Jason Potteiger
Self-coded data should be a tier above gold. So why can't we reproduce it?
LLMs predicting customer ratings from open-text feedback systematically under-predict. At first it looks like a prompt or model problem,but our analysis shows something else. The counterintuitive insight: the AI might be more useful than the human score. The gap between prediction and self-report is the clearest early warning your happiest-looking customers are growing restless.
When something simple doesn’t work there’s usually more going on. And on paper, this one is simple.
Imagine a respondent picking a number between 0 and 10 on a survey. Immediately after, they provide their rationale: a few sentences explaining why they picked that number. Same person, same moment, same experience, and both outputs produced within seconds of each other. There’s no room for anything to get lost in translation.
That is the intuition I started with. If human-coded data is a gold standard we benchmark LLM annotations against, then self-coded data should sit a tier above gold. The person who wrote the rationale is the same person who picked the number.
An LLM reading the text ought to be able to reproduce the number. Except it can’t about 30% of the time. Not with frontier models, and not with a week of prompt engineering.
We benchmarked an LLM-as-labeler against the respondent’s own numeric rating on a 0-to-10 scale: 33% matched perfectly, and within-±1 agreement fell out around 67%.
What followed is what you’d expect: prompt iteration, a model swap, a different data set. The best version landed at 69.
At this point someone in our group asked something like: is this as good as it gets?
As it turns out, yes.
What we discovered is that an LLM-labeled score and the user’s own numeric rating aren’t comparable. The predicted score is measuring a gap between what that user wrote and what that user decided. Those are two different cognitive outputs of the same respondent, and the difference between them cannot be closed by a prompt.
If you want to stop reading here, this is the “so what?”
There is information in the textual data of surveys that isn’t represented by the scores. You need to look at both.
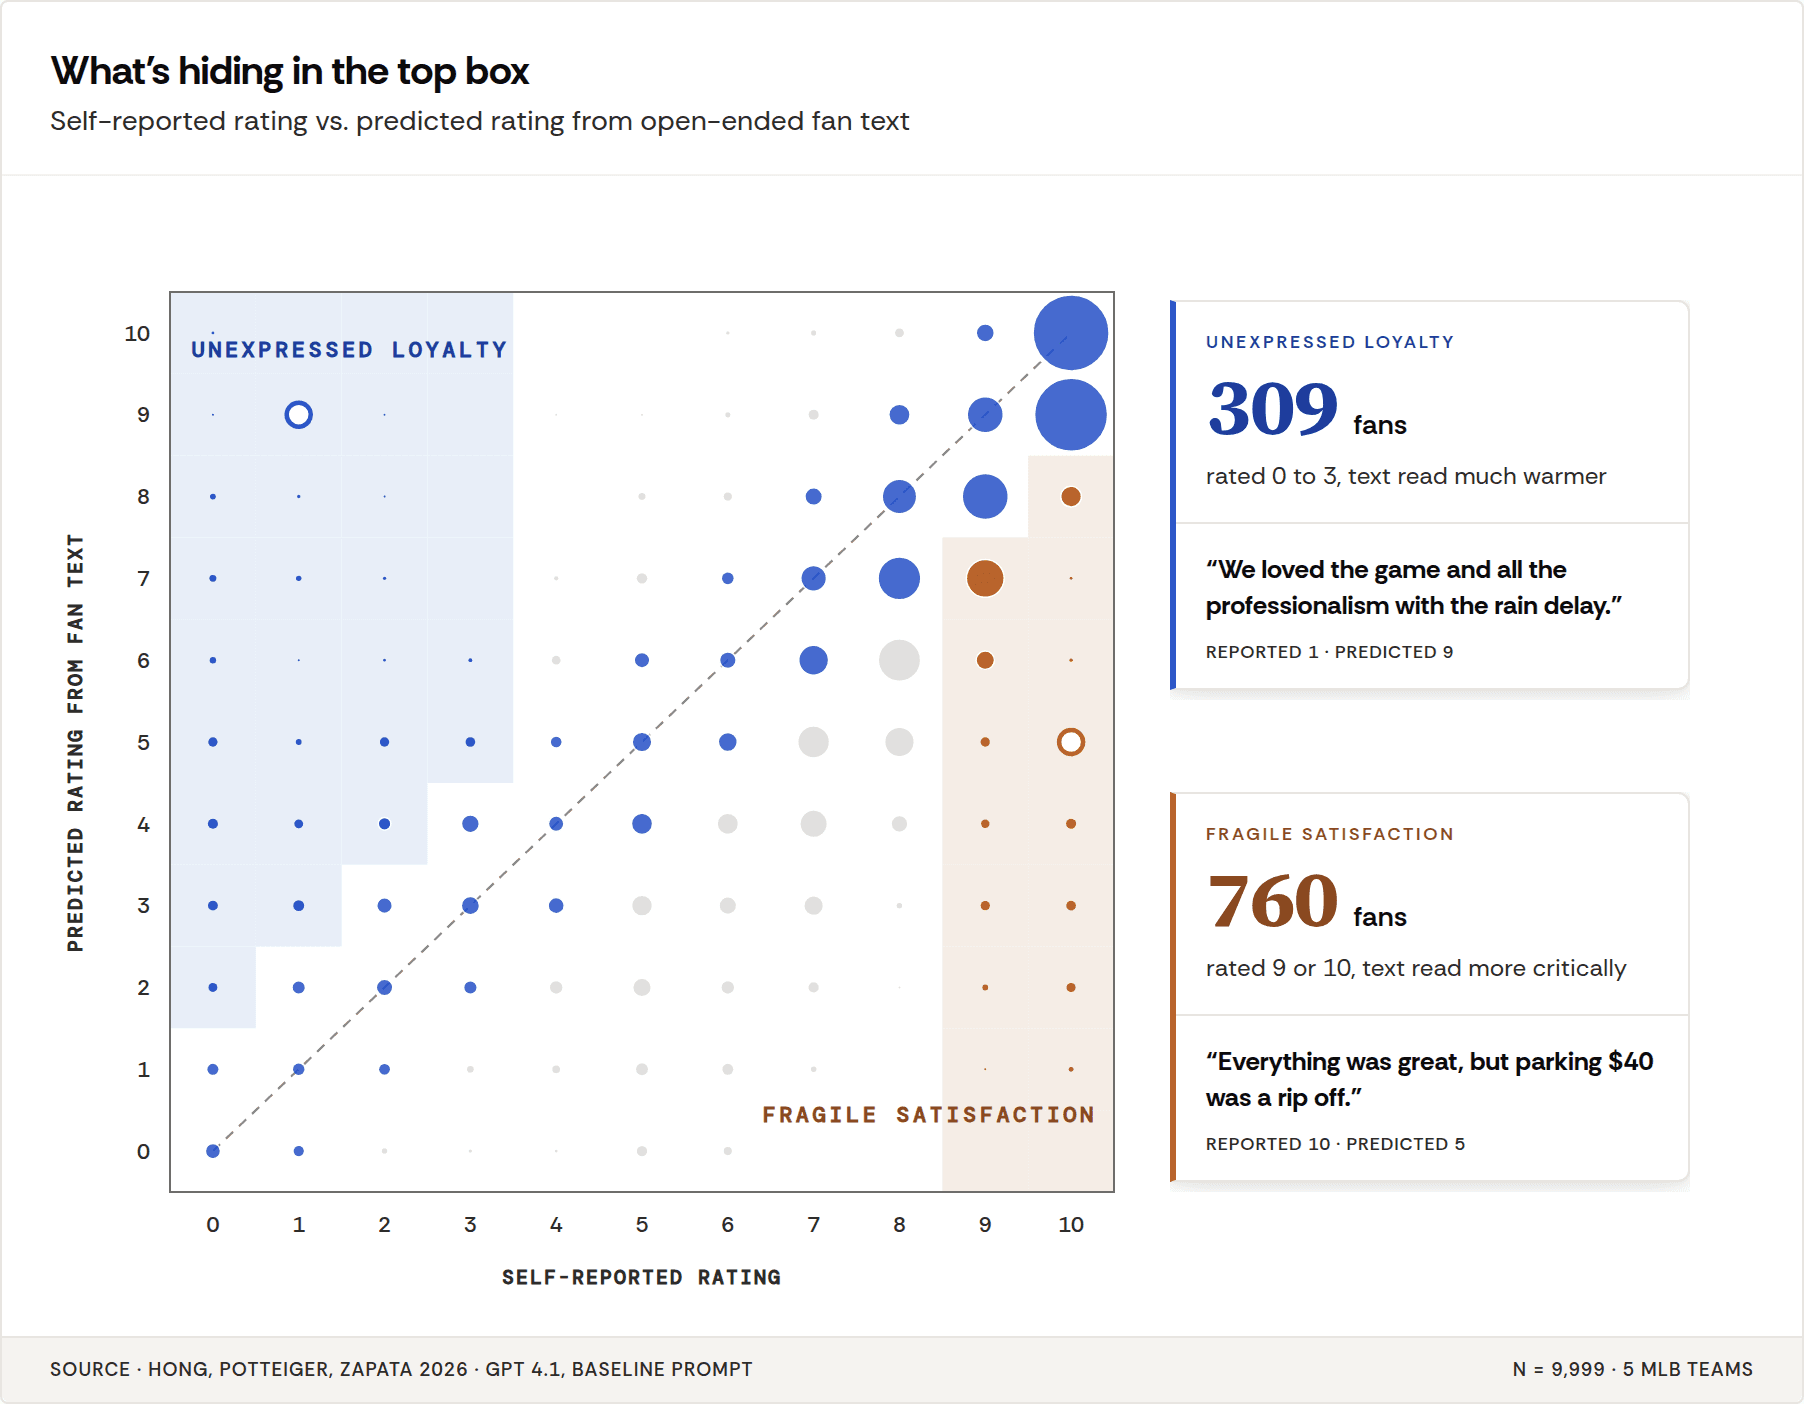
When a respondent rates a 10 but provides negative feedback in the open end, we call this fragile satisfaction and it’s a critical signal to catch.
You can use the LLM to identify when a positive rating has negative feedback because the predicted score and self-reported score diverge.
Our other research found that the LLM scores are extremely reliable, they reason they don’t match the self-reported score is because the text captures a different signal.
The shape of the miss
For the data nerds: If the eval’s miss were noise, the errors would cluster symmetrically around zero. In a validation dataset I keep returning to (about 10,000 post-game fan surveys, each with a zero-to-ten rating and a free-text rationale), 86 percent of the large prediction errors were under-predictions. The model read the text and called it a 6. The fan rated it an 8. Aggregate bias ran at −0.96 on a ten-point scale, and the misses concentrated in the 5-to-8 band, where fans described friction in the rationale and forgave it in the verdict.
For everyone else: Random measurement error looks like a cloud. This looks like an arrow (see graphic).
What actually moves the number
The second thing to see is what moves the number. We filtered the same run on two subsets of the gold+ set: purely positive rationales, and purely negative rationales. Within-±1 agreement on the positive subset came back at 86 percent. On the negative subset, 44 percent. A 42-point gap inside the same instrument, driven by nothing except the lexical character of what the respondent wrote.
Now compare that to the engineering levers. We landed on an optimized prompt with a customized rubric and tested this with two frontier models. This added about 2 points of within-±1 to our baseline. A newer reasoning model (GPT 5.2) actually regressed to baseline.
Two points for a day of work.
And the two points have a specific shape. The prompt improvement showed up uniformly across text types, which is not what better reasoning looks like. It’s what bias correction looks like. The LLM came into the task already associating surface-negative words with low ratings, and a better-written prompt partially corrects for it. Swapping the models (as we did) you either lose the correction or inherit a new bias you haven’t measured.
The implication is the signal within the text itself is having a bigger impact than any changes to the prompt or model. Put another way, the fundamental characteristics of the respondent’s writing are the primary drivers of the model’s output.
Okay, (you might think) so you can’t get water from a stone. If there’s no signal to make a prediction the prediction is poor. That seems obvious.
Perhaps, but there’s more.
Two cognitive operations, one form
Imagine watching someone at the grocery store put a box of cereal in their cart and asking, while the wheels are still turning, why they picked that sku. They should be able to explain why. But can they? It turns out maybe not.
We dove into the literature and discovered established theories explaining the gap. Two cognitive operations are happening at the moment a user fills out a survey. When the form asks for free text, the respondent does retrieval: specific incidents come to mind, usually the ones salient at that moment, and those are what get written down. When the same form asks for a numeric rating, the respondent does evaluation. Different operation, different output.
A fan who waited 40 minutes at a concession stand in the third inning and then watched a walk-off home run in the ninth will write a rationale that centers on the line, and rate the night a 9. The text recalls the friction. The number remembers the walk-off. Same fan, same evening, two cognitive outputs produced thirty seconds apart on the same form.
Norbert Schwarz’s work on how people construct survey responses lays out the retrieval side: the text reflects what the respondent can currently access, filtered by whatever the ambient frame makes salient at the moment the question is posed. Decades before anyone tried benchmarking GPT against NPS it was found that remembered experience gets dominated by “peak-and-end moments” and “modulated by current affect”.
The takeaway here is that the number is a verdict, not a summary of the text the same respondent just wrote.
The information that would allow the AI to perfectly predict the score is not in the document. It seems like it should be right there, but it isn’t. The respondent’s private calibration of what a 7 means on a scale is anchored in their head. That information never entered the pipeline.
The obvious objection
The likely pushback at this point is sharp enough to take seriously. It goes: I do not care what the user was doing cognitively. If the model predicts a 6 and the user said 9, it’s wrong.
I’d argue that it’s actually more correct.
Most use cases for a score, predicted or otherwise, are based on thresholds. Top-box loyalty flag, at-risk save-call flag, NPS buckets, etc. On this dataset, top-box precision ran between 94 and 96 percent across all four configurations. The directional under-prediction that makes the model’s annotation accuracy look bad as a scalar estimator is precisely what makes it reliable as a top-tier classifier.
Once you see that, the frame changes entirely. The question stops being “did the model predict the exact number?” and becomes “did the model put the customer in the right bucket?” according to what they reported.
Put another way, when the model does say someone is in the top box, it really means it. The model had to ignore nothing negative to get there. The cautiousness that makes it a bad regression model makes it a trustworthy classifier.
Fragile Satisfaction: The customers who matter most look fine.
Why bother generating a predicted score for a record that already has one?
We’ve learned the score and the text are measuring different things, and it’s the customers you most need to hear from where those two measurements disagree.
We’re calling it fragile satisfaction. A loyal Starbucks customer rates a location a 9. In their rationale, almost as an aside, they note that the bathroom was disgusting. This is your biggest fan, and they’re giving you a break. They assume someone is listening. The rating reflects affinity, habit, and the peak moment of their last great visit. The text is telling you what’s actually broken.
In aggregate, fragile satisfaction is invisible. A brand averaging 8.5 CSAT looks healthy. But if 30 percent of those top-box customers are writing about parking, wait times, or a checkout flow they’ve worked around twice, the 8.5 is a loan. One more friction (a price increase, a policy change, a bad day) and the number comes down to meet the text.
There’s a mirror case, too. A customer writes warmly about a product and then rates it a 1 because of one bad interaction. The predicted score comes in higher than the reported one, and the text shows you the affinity the verdict buried. Call it unexpressed loyalty. Same instrument, other direction but an equally valuable diagnostic.
The predicted score surfaces both populations because it reads what the customer chose to write about, not what the customer chose to conclude.
The gap is what’s actionable.
Customer experience measurement tends to treat the scalar rating as ground truth and the text as commentary on it (there wasn’t really any other option). Our point of view is the text is the most relevant source of truth for operationally salient information.
And a useful measurement is the distance between the self-reported rating and the predicted score assigned by the LLM.
When the predicted score drifts below the self-reported score across a cohort, customers are writing about more friction while still forgiving it. That gap closes one of two ways. Either operations improve and the text catches up to the verdict, or satisfaction erodes and the verdict catches up to the text. The aggregate CSAT dashboard will tell you only after the second thing has happened. The gap tells you while you can still pick.
Sources:
Hong, A., Potteiger, J., & Zapata, I. (2026). LLM Predictive Scoring and Validation: Inferring Experience Ratings from Unstructured Text. arXiv:2604.14321. https://arxiv.org/abs/2604.14321
Hong, A., Potteiger, J., & Zapata, L. E. (2026). The Signal is the Ceiling: Measurement Limits of LLM-Predicted Experience Ratings from Open-Ended Survey Text. arXiv:2604.19645. https://arxiv.org/abs/2604.19645