
Jason Potteiger
Vice President Solutions
In 2024, the average enterprise data team spent roughly 40% of its analytical capacity producing reports that described what had already happened. Dashboards refreshed. Quarterly decks assembled. Metrics trended. The work was real, the rigor was genuine, and the output was, almost without exception, backward-looking. The constraint was never the team's skill. It was the data they had to work with: structured fields from transactional systems — purchases, tickets, sessions, clicks — and a thin layer of survey scores collected from the fraction of customers who opted in.
That description is about to become obsolete. Not because the tools are changing. Because the input is.
One Methodology, One Dataset
Every channel in the enterprise generates customer language. Support transcripts in Zendesk. Call recordings in Five9. Survey verbatims in Qualtrics. Reviews on Google. Emails in Outlook. Each platform has its own metric, its own format, its own analytical silo. CSAT lives in one system. NPS in another. QA scores in a third. Star ratings in a fourth. Cross-source analysis requires manual normalization that is so tedious it rarely happens, and when it does, the methodological differences between instruments make the comparisons suspect.
Predictive scoring dissolves this problem at the source. The same prompt function, the same scale, the same behavioral anchors, applied to every text record regardless of where it originated. The output is not five incompatible metrics from five platforms. It is one structured field — predicted satisfaction on a -2 to +2 scale — across every channel, joinable in a single table.
Before | After | |
Support transcripts | No metric unless survey sent (5–10% response) | Predicted CSAT -2 to +2, decomposed, 100% coverage |
Survey verbatims | CSAT from structured question; text unscored | Predicted CSAT -2 to +2 from text, comparable across sources |
Online reviews | Star rating 1–5, platform-specific, no anchoring | Predicted CSAT -2 to +2, same methodology |
Email threads | No metric | Predicted CSAT -2 to +2 where sufficient signal exists |
Filter by source for channel-specific patterns. Aggregate for a composite view. Test whether satisfaction differs by channel — a question that was previously unanswerable because the metrics themselves were incompatible. The constraint remains: not every source supports every score type. The methodology handles this through null conditions, not forced scoring. Where the text supports a score, the output is comparable by design. Where it does not, the field is null.
But harmonization is a feature. The real shift is structural.
An Enrichment Pipeline
A data team that implements predictive scoring has, whether it intended to or not, built the infrastructure for a fundamentally different relationship with its unstructured data.
The pipeline has four stages. Ingestion and normalization: data arrives from support platforms, telephony systems, survey tools, review aggregators, email systems, CRMs, social listening tools, and is standardized into a common schema — record ID, timestamp, raw text, source metadata. Enrichment: normalized text passes through prompt functions, and a single record might produce a predicted CSAT, an agent satisfaction score, a topic classification, an emotion label, a churn signal, and a product issue extraction in one pass. Structured output: results are written as new fields — each dimension a column with a defined type, value range, and null handling, queryable and joinable with any table sharing the record identifier. Warehouse integration: enriched data lands alongside operational and transactional tables, available to BI tools, SQL, statistical models, and agentic workflows.
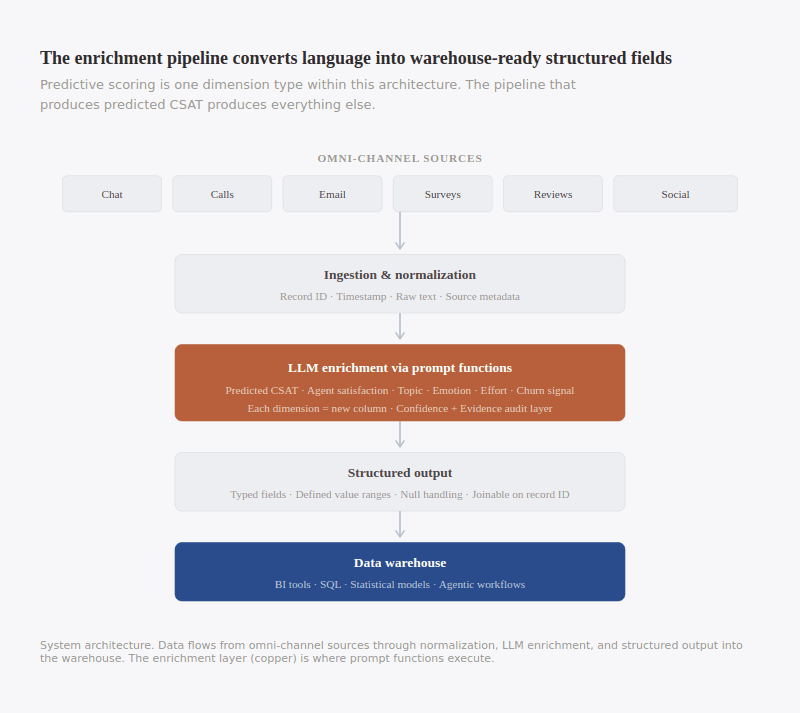
That pipeline was built to produce predicted CSAT. But the same architecture produces topic classifications. It produces emotion labels. Intent tags. Churn signals. Product feedback themes. Resolution status. Any structured dimension an LLM can extract from text. Predictive scoring is the most interpretable output, which is why it is the right starting point. But the infrastructure it requires is the same infrastructure that powers every other dimension. Adding a new dimension is incremental: a new prompt function, a new output field, the same pipeline. The marginal cost is low. The infrastructure cost was paid once.
This is the point most organizations miss. They evaluate predictive scoring as a measurement improvement — a way to get CSAT on more interactions. It is that. But the deeper value is that it forces the construction of something the enterprise has never had: a governed pipeline that converts unstructured language into structured, warehouse-ready data at scale. Once that pipeline exists, the question is no longer "should we score satisfaction?" It is "what else should we extract?" And the answer is: everything the text contains that the business needs to know.
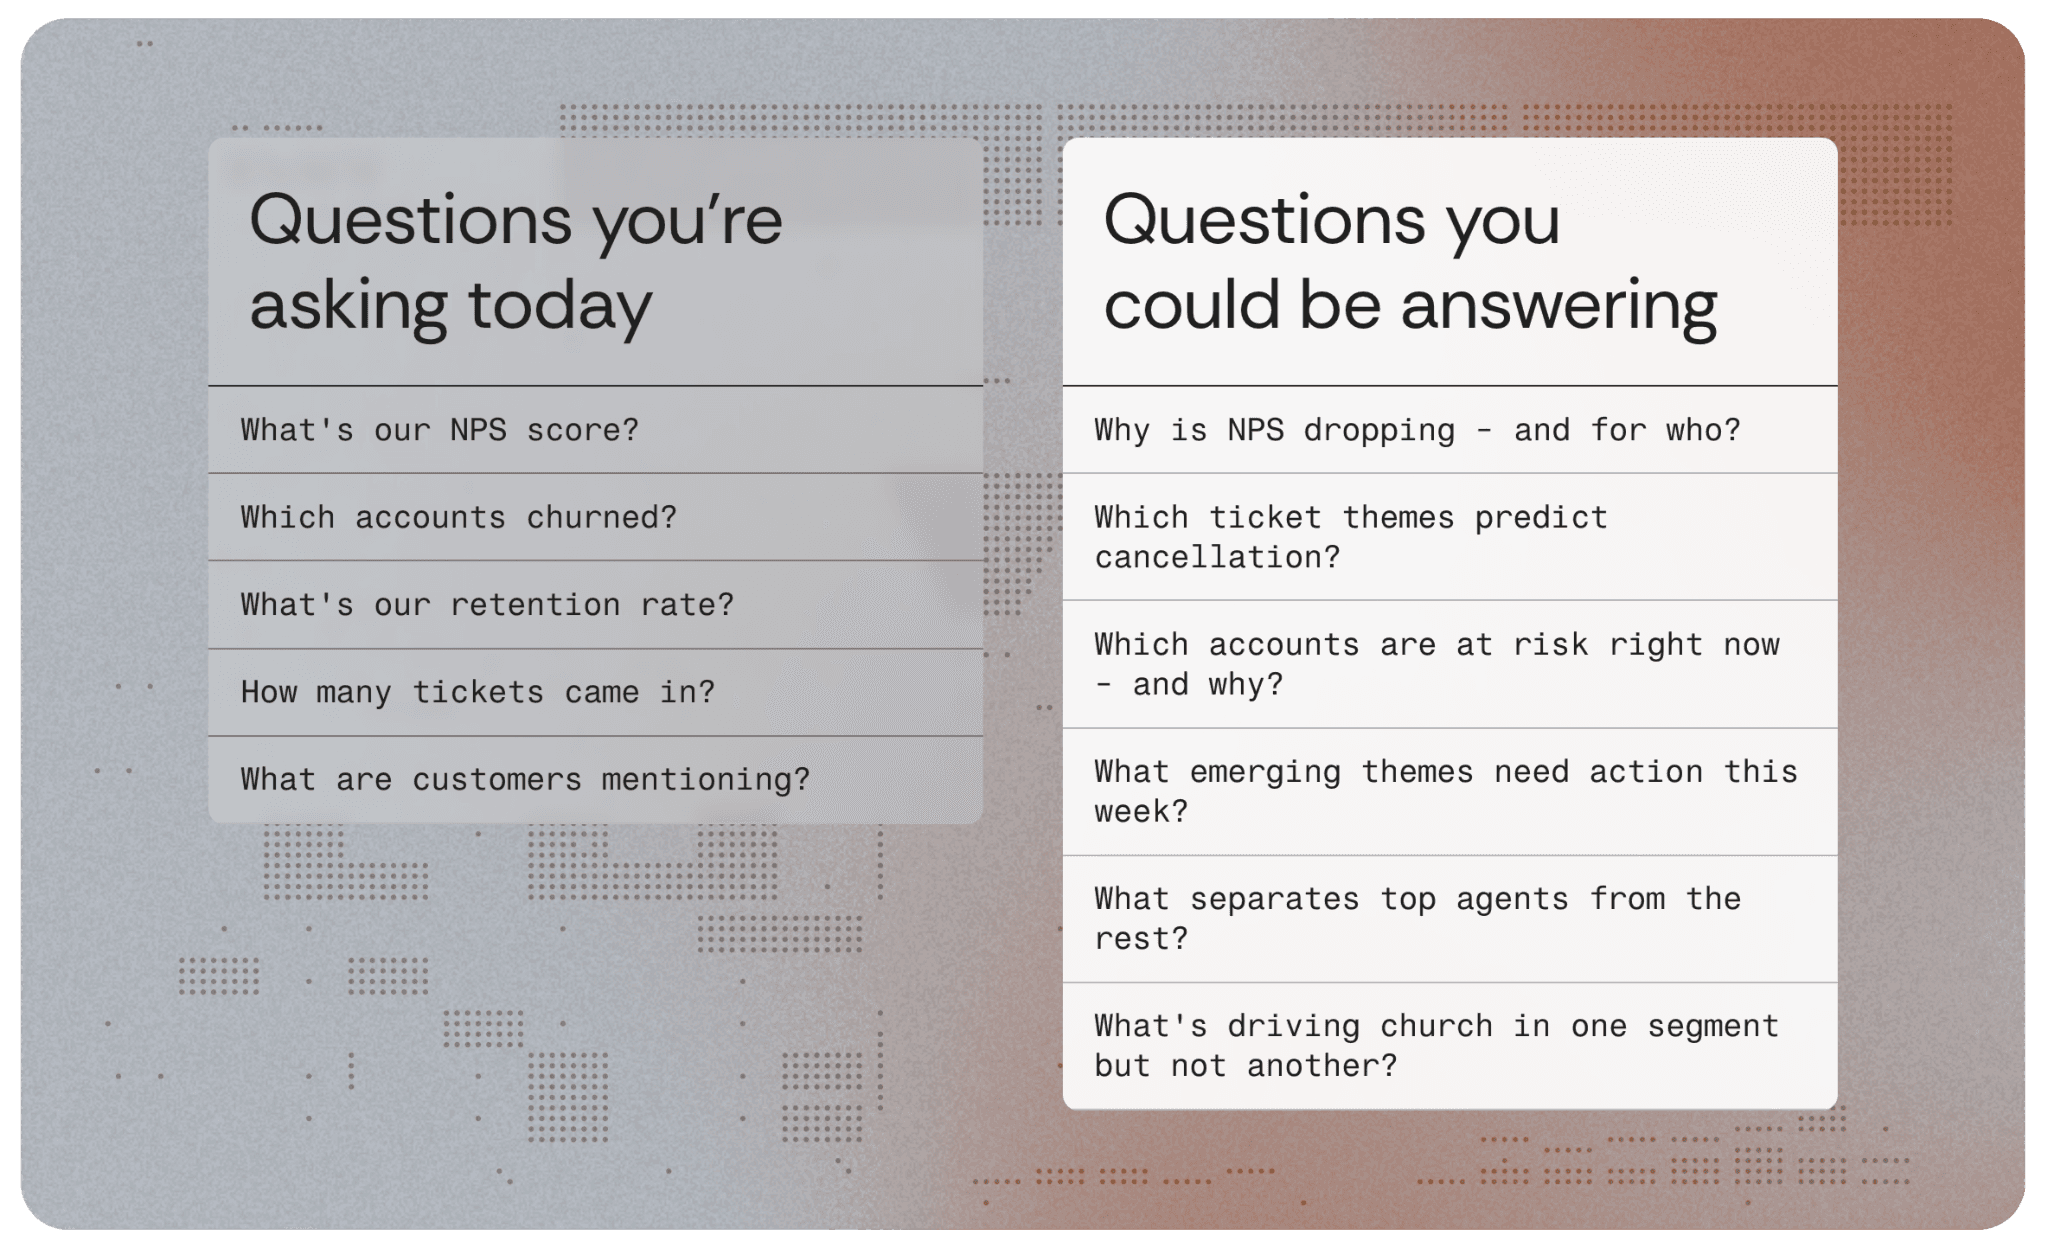
Automated intelligence
Consider what happens when every record in a dataset carries not just a predicted satisfaction score but a full enrichment profile: satisfaction, effort, topic, emotion, resolution status, product feedback, churn signal — ten or fifteen structured fields where previously there was a single blob of text. That dataset is no longer waiting for a human analyst to ask the right question. It is available to automated analytical workflows.
An agentic system scanning enriched customer data notices that predicted outcome satisfaction for a specific product line has dropped 0.8 points over two weeks. It cross-references the timing with operational data and identifies a policy change deployed on the same date. It runs a difference-in-differences test against product lines unaffected by the change. The effect is statistically significant. It generates a finding, cites the evidence, and routes it to the product team — with the specific transcripts, the decomposed scores showing that agent satisfaction held steady while outcome satisfaction collapsed, and a recommended investigation scope.
Institutional shift
Most organizations still treat customer language as something to be sampled, summarized, and presented. An insights team reads transcripts, identifies themes, builds a slide deck, and presents findings at a quarterly review. The findings are real but the process is slow.
Predictive scoring challenges that approach. The output is not a narrative. It is a structured field with a data type, a value range, and a record identifier. It belongs in the data warehouse, not in a presentation. And it is the data team's domain.
The organizations that will gain the most from predictive scoring are not the ones that implement it as a measurement tool. They are the ones that adopt it as the first layer of a meaning infrastructure that makes customer language as queryable, joinable, and actionable as any other data the enterprise produces.