
From Chaos to Context: How Knowledge Graphs and Agentic Workflows Are Reimagining Unstructured Data
For years, the analytics world has revolved around structure. Rows, columns, schemas, and dashboards have been our tools for understanding reality. Yet beneath this structured world lies a vast ocean of unstructured data — customer conversations, support chats, survey responses, emails, transcripts — the raw language of how customers think, feel, and act.
This unstructured layer holds extraordinary intelligence. But it’s historically been too messy, too dynamic, and too context-rich for traditional analytics. BI tools can visualize, but they can’t reason. Databases can query, but they can’t understand.
That’s changing — fast.
We’re now entering a new era where Knowledge Graphs and Agentic Workflows are redefining how we interpret, connect, and act on language data. This fusion marks the beginning of what I call The Age of Language Intelligence — where every insight, every decision, and every workflow can be dynamically powered by the meaning encoded in human language.
At Dimension Labs, we’ve spent the past several years building toward this frontier. Our goal: transform the world’s unstructured conversational data into structured, queryable intelligence — not by forcing it into rigid schemas, but by giving it a living, contextual brain.
The Hidden Layer of Enterprise Intelligence
Every organization already has its data warehouse — the backbone of structured analytics. But ask any data leader, and they’ll admit: the real insights are locked in their “dark data.”
Customer feedback forms, transcripts of support calls, sales notes, chat logs — these are where the truth lives. They reveal why customers churn, how they feel about product changes, and where inefficiencies originate.
Traditional NLP pipelines and sentiment analysis gave us a glimpse, but they’re still fundamentally shallow. They treat language as a flat surface — a collection of keywords and emotions. What they miss is the web of relationships — between entities, intents, causes, and effects.
To make unstructured data truly usable, we don’t just need better models — we need structure that understands meaning.
That’s where Knowledge Graphs come in.
The Missing Intelligence Layer: Knowledge Graphs
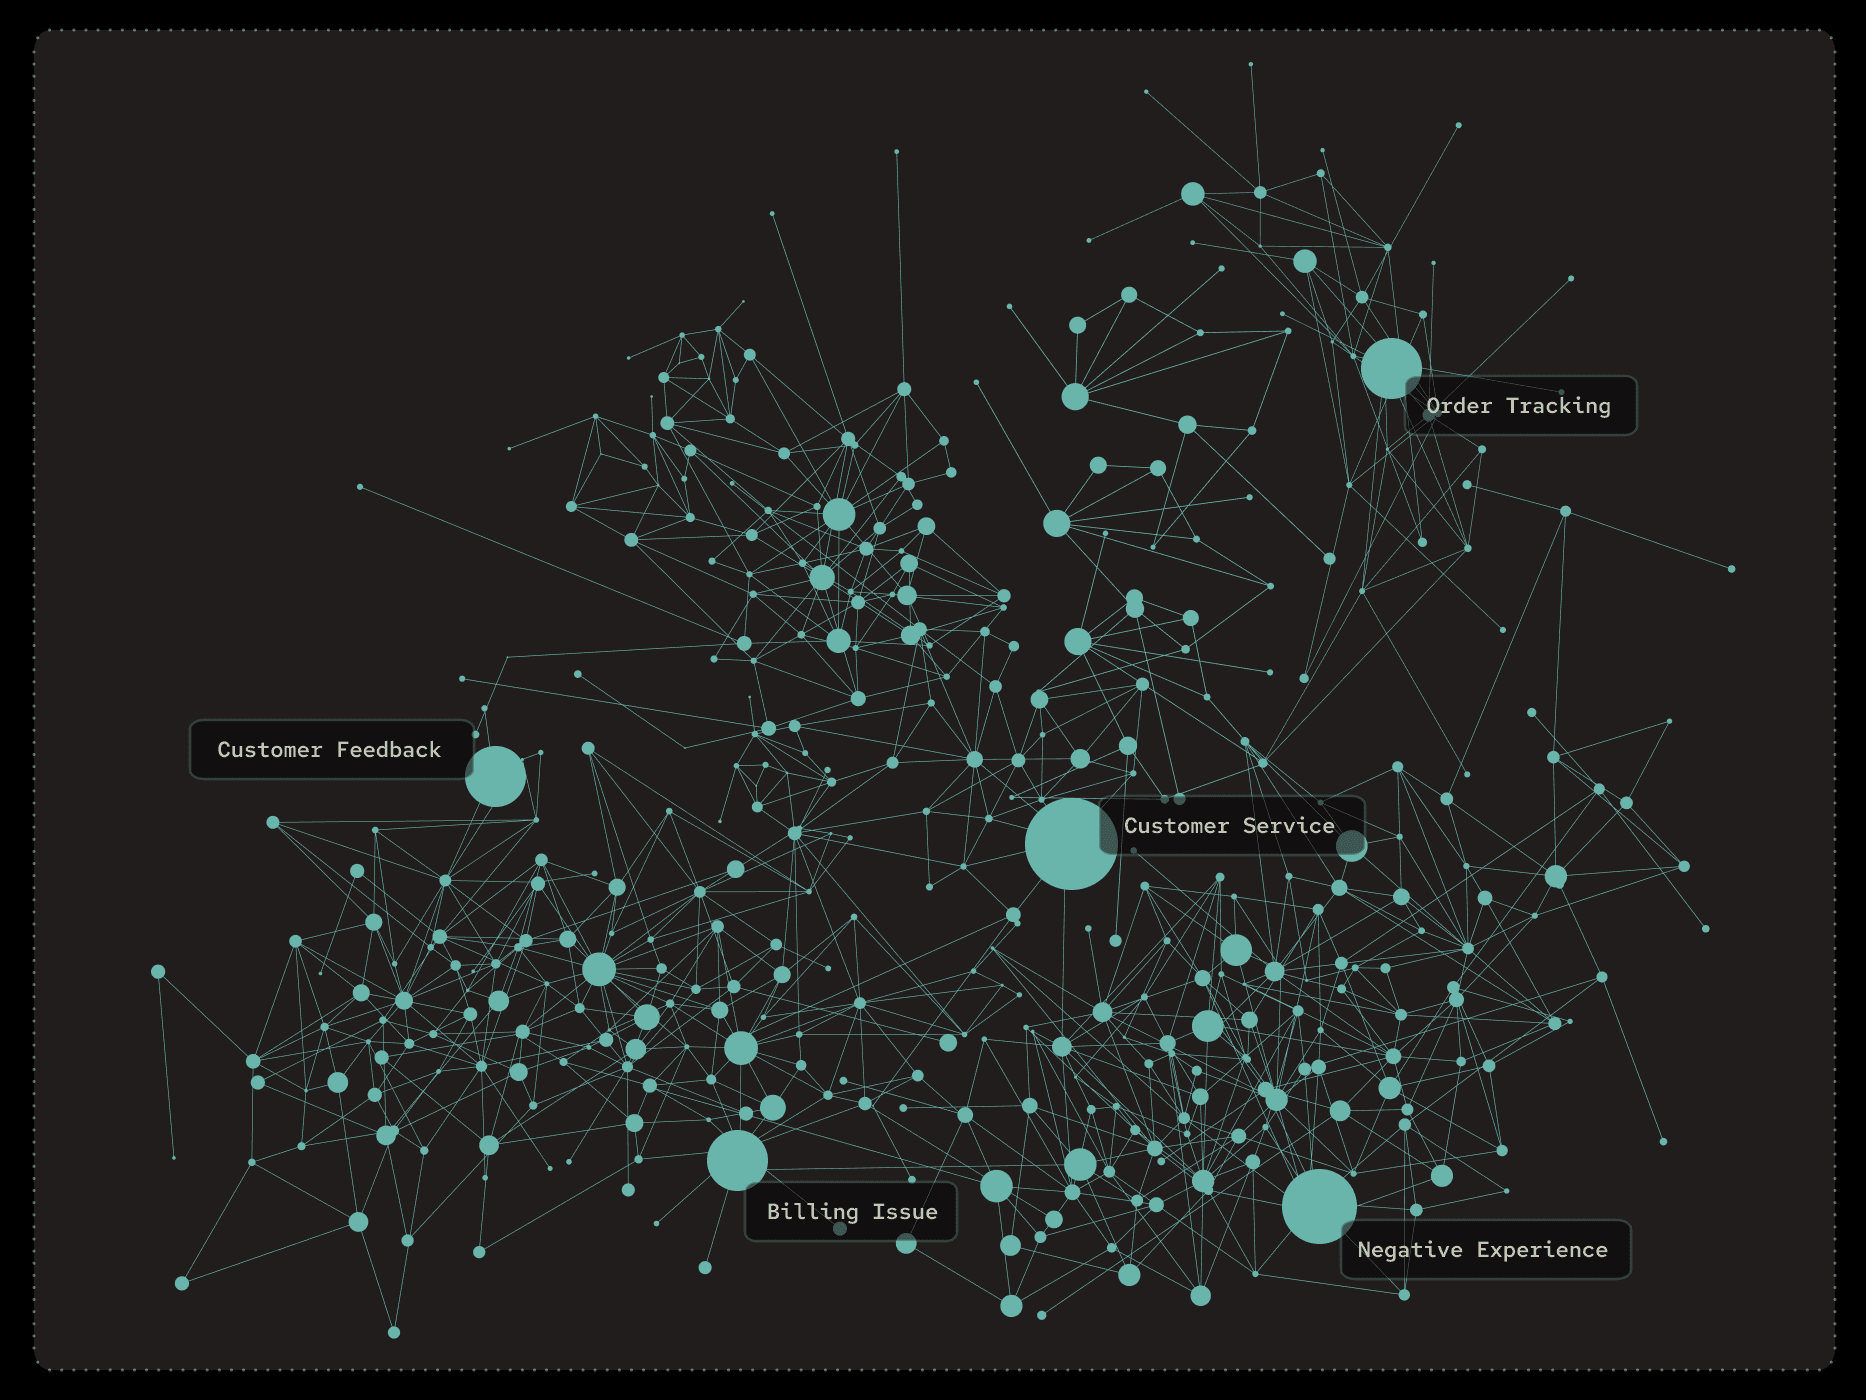
A Knowledge Graph transforms disconnected data points into a network of meaning. Each node represents an entity — a concept, a person, a product feature, a customer issue — and each edge defines how those concepts relate.
In a customer analytics context, this means mapping out the entire semantic landscape of interactions:
Which product features are most discussed alongside “frustration”?
What topics correlate with high and low NPS scores?
Which issues tend to precede churn events?
By encoding these relationships, Knowledge Graphs allow machines (and humans) to navigate complexity intuitively — moving beyond “keyword counts” to actual knowledge reasoning.
At Dimension Labs, every dataset processed by our platform is automatically converted into a knowledge graph of insights.
This graph evolves dynamically: new conversations enrich existing clusters, new themes emerge organically, and correlations strengthen over time. What emerges is not just an index of language — it’s a living model of customer intelligence.
Agents: The New Workforce for Data Analysis
If Knowledge Graphs represent context, then Agents represent action.
The rise of agentic AI — autonomous, multi-step systems that can reason, retrieve, and execute — introduces a new way to interact with data. Agents are no longer passive responders to prompts; they are collaborators that plan, decompose, and act.
At Dimension Labs, we’ve embedded specialized agents throughout the analytics workflow to automate what used to be manual, disjointed steps.
Let’s walk through how these come together.
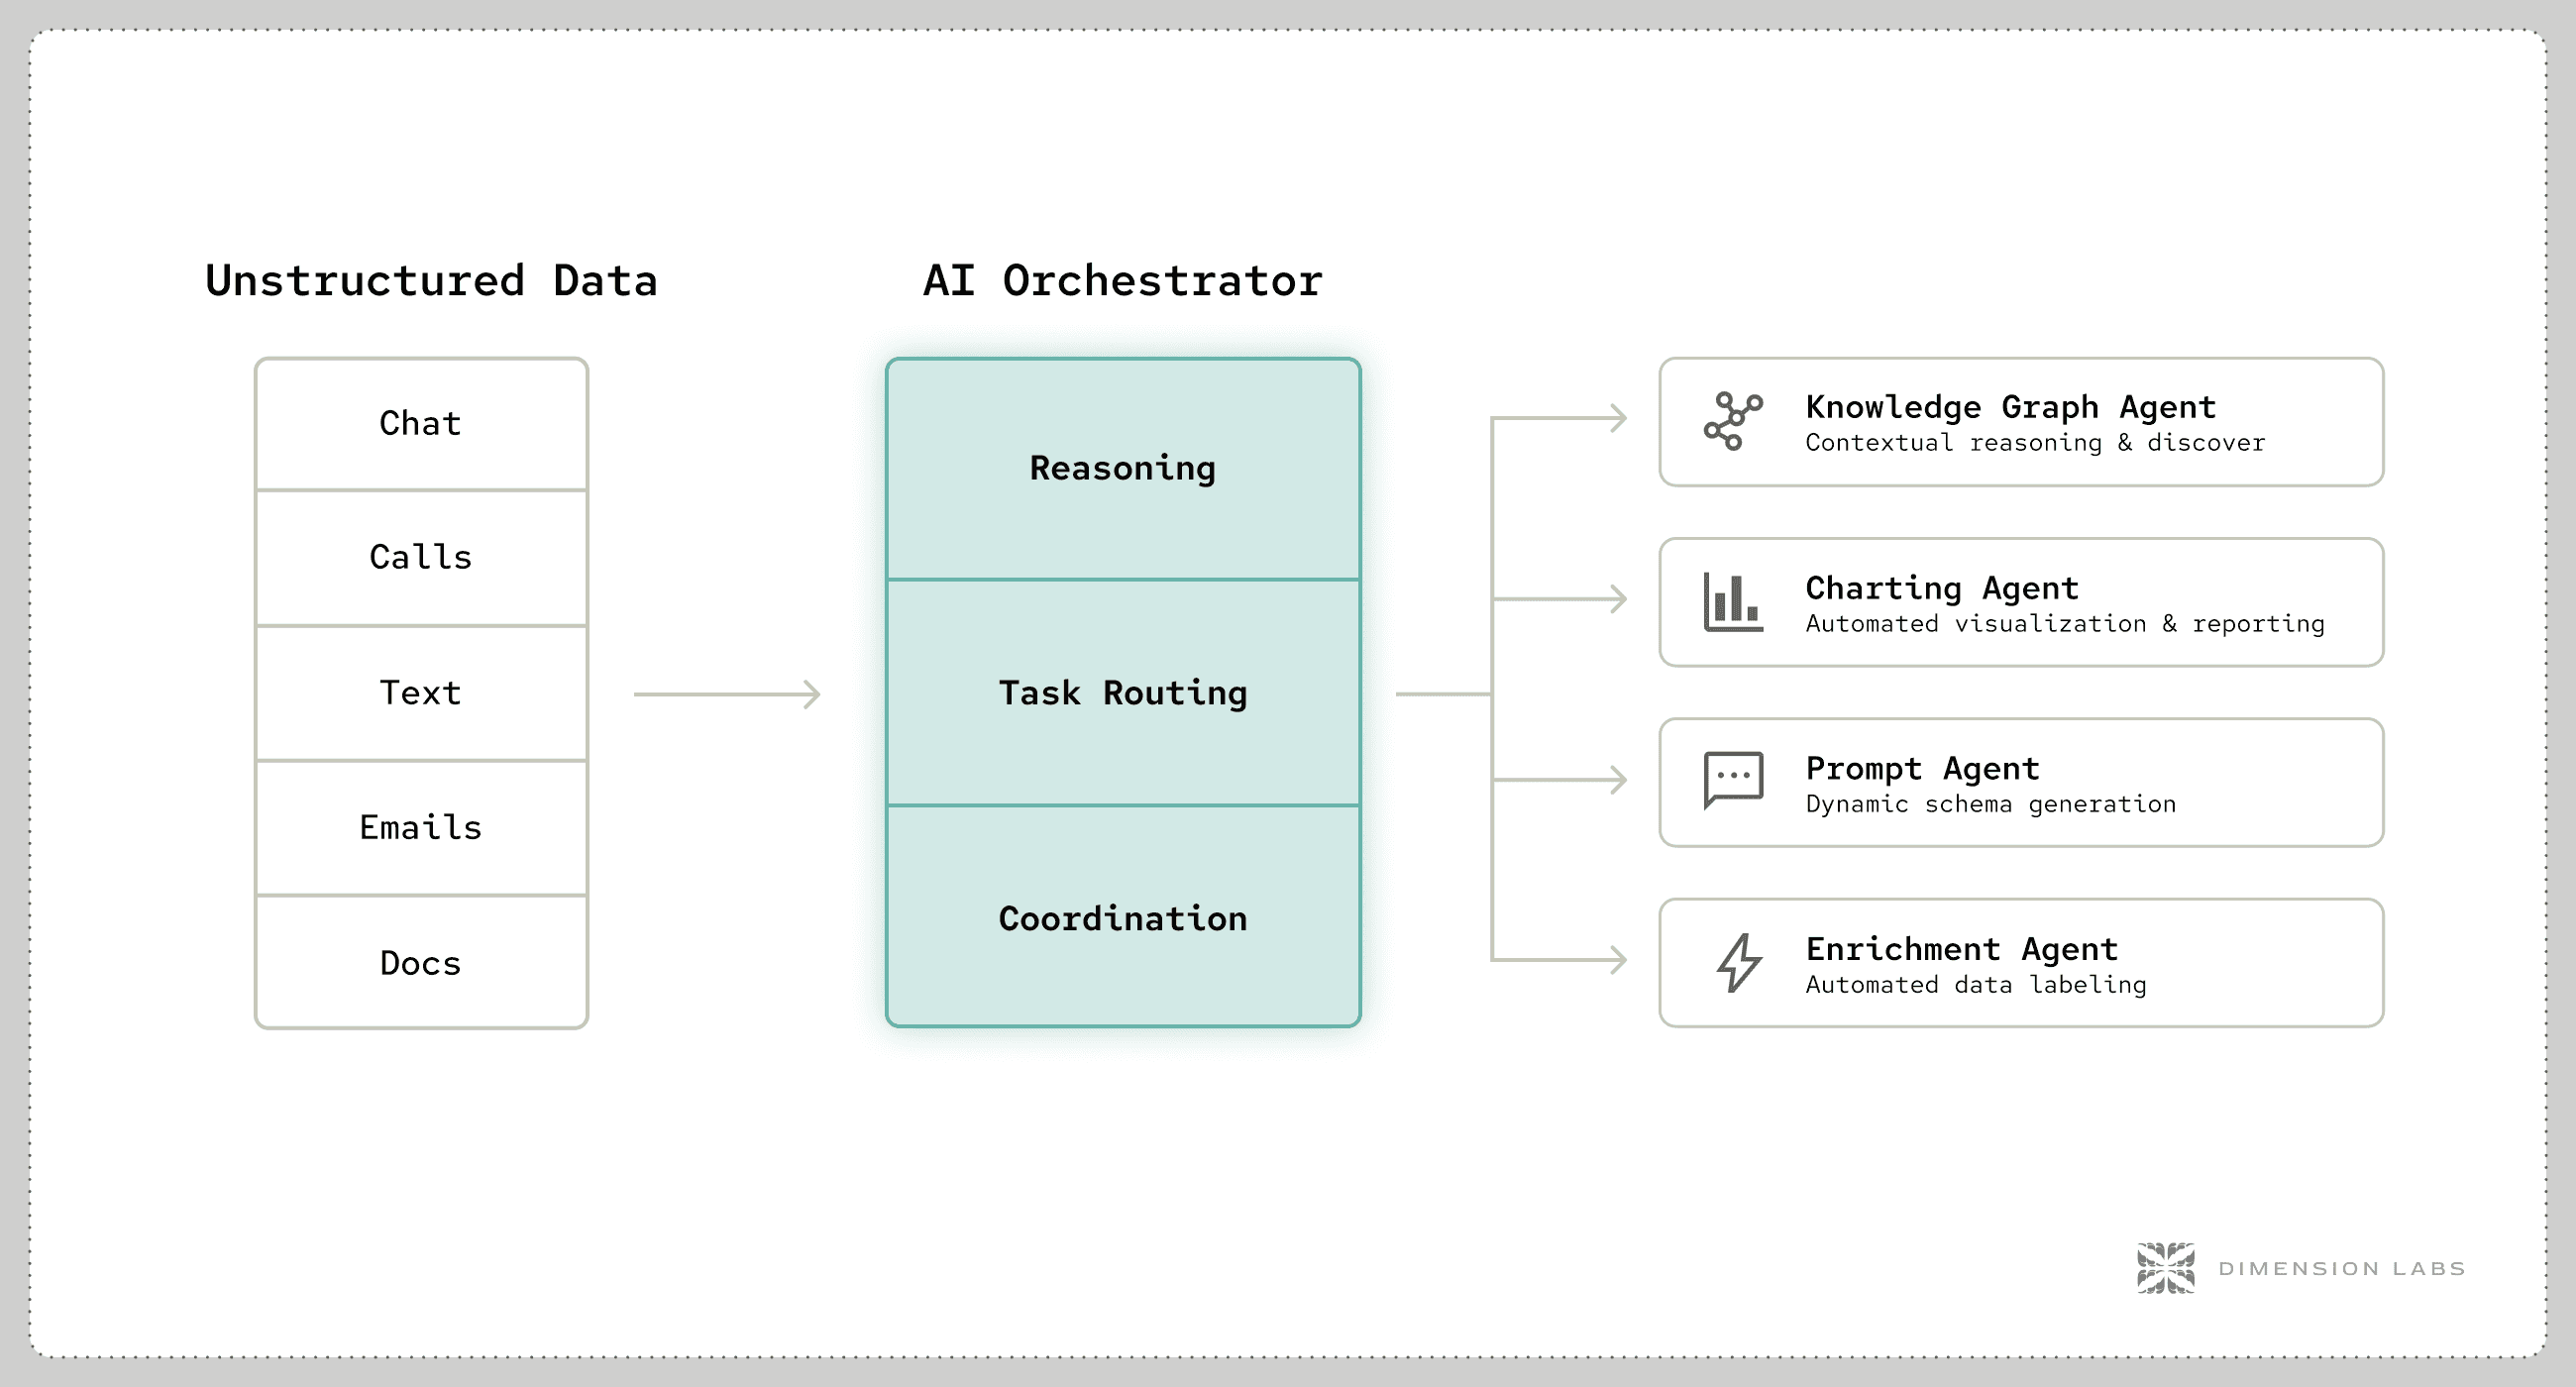
The AI Orchestrator: A New Interface for Unstructured Data
In the AI Orchestrator — our conversational analytics interface — users can ask open-ended questions like:
“Summarize the most important insights and correlations found in my dataset, highlighting key patterns and anomalies.”
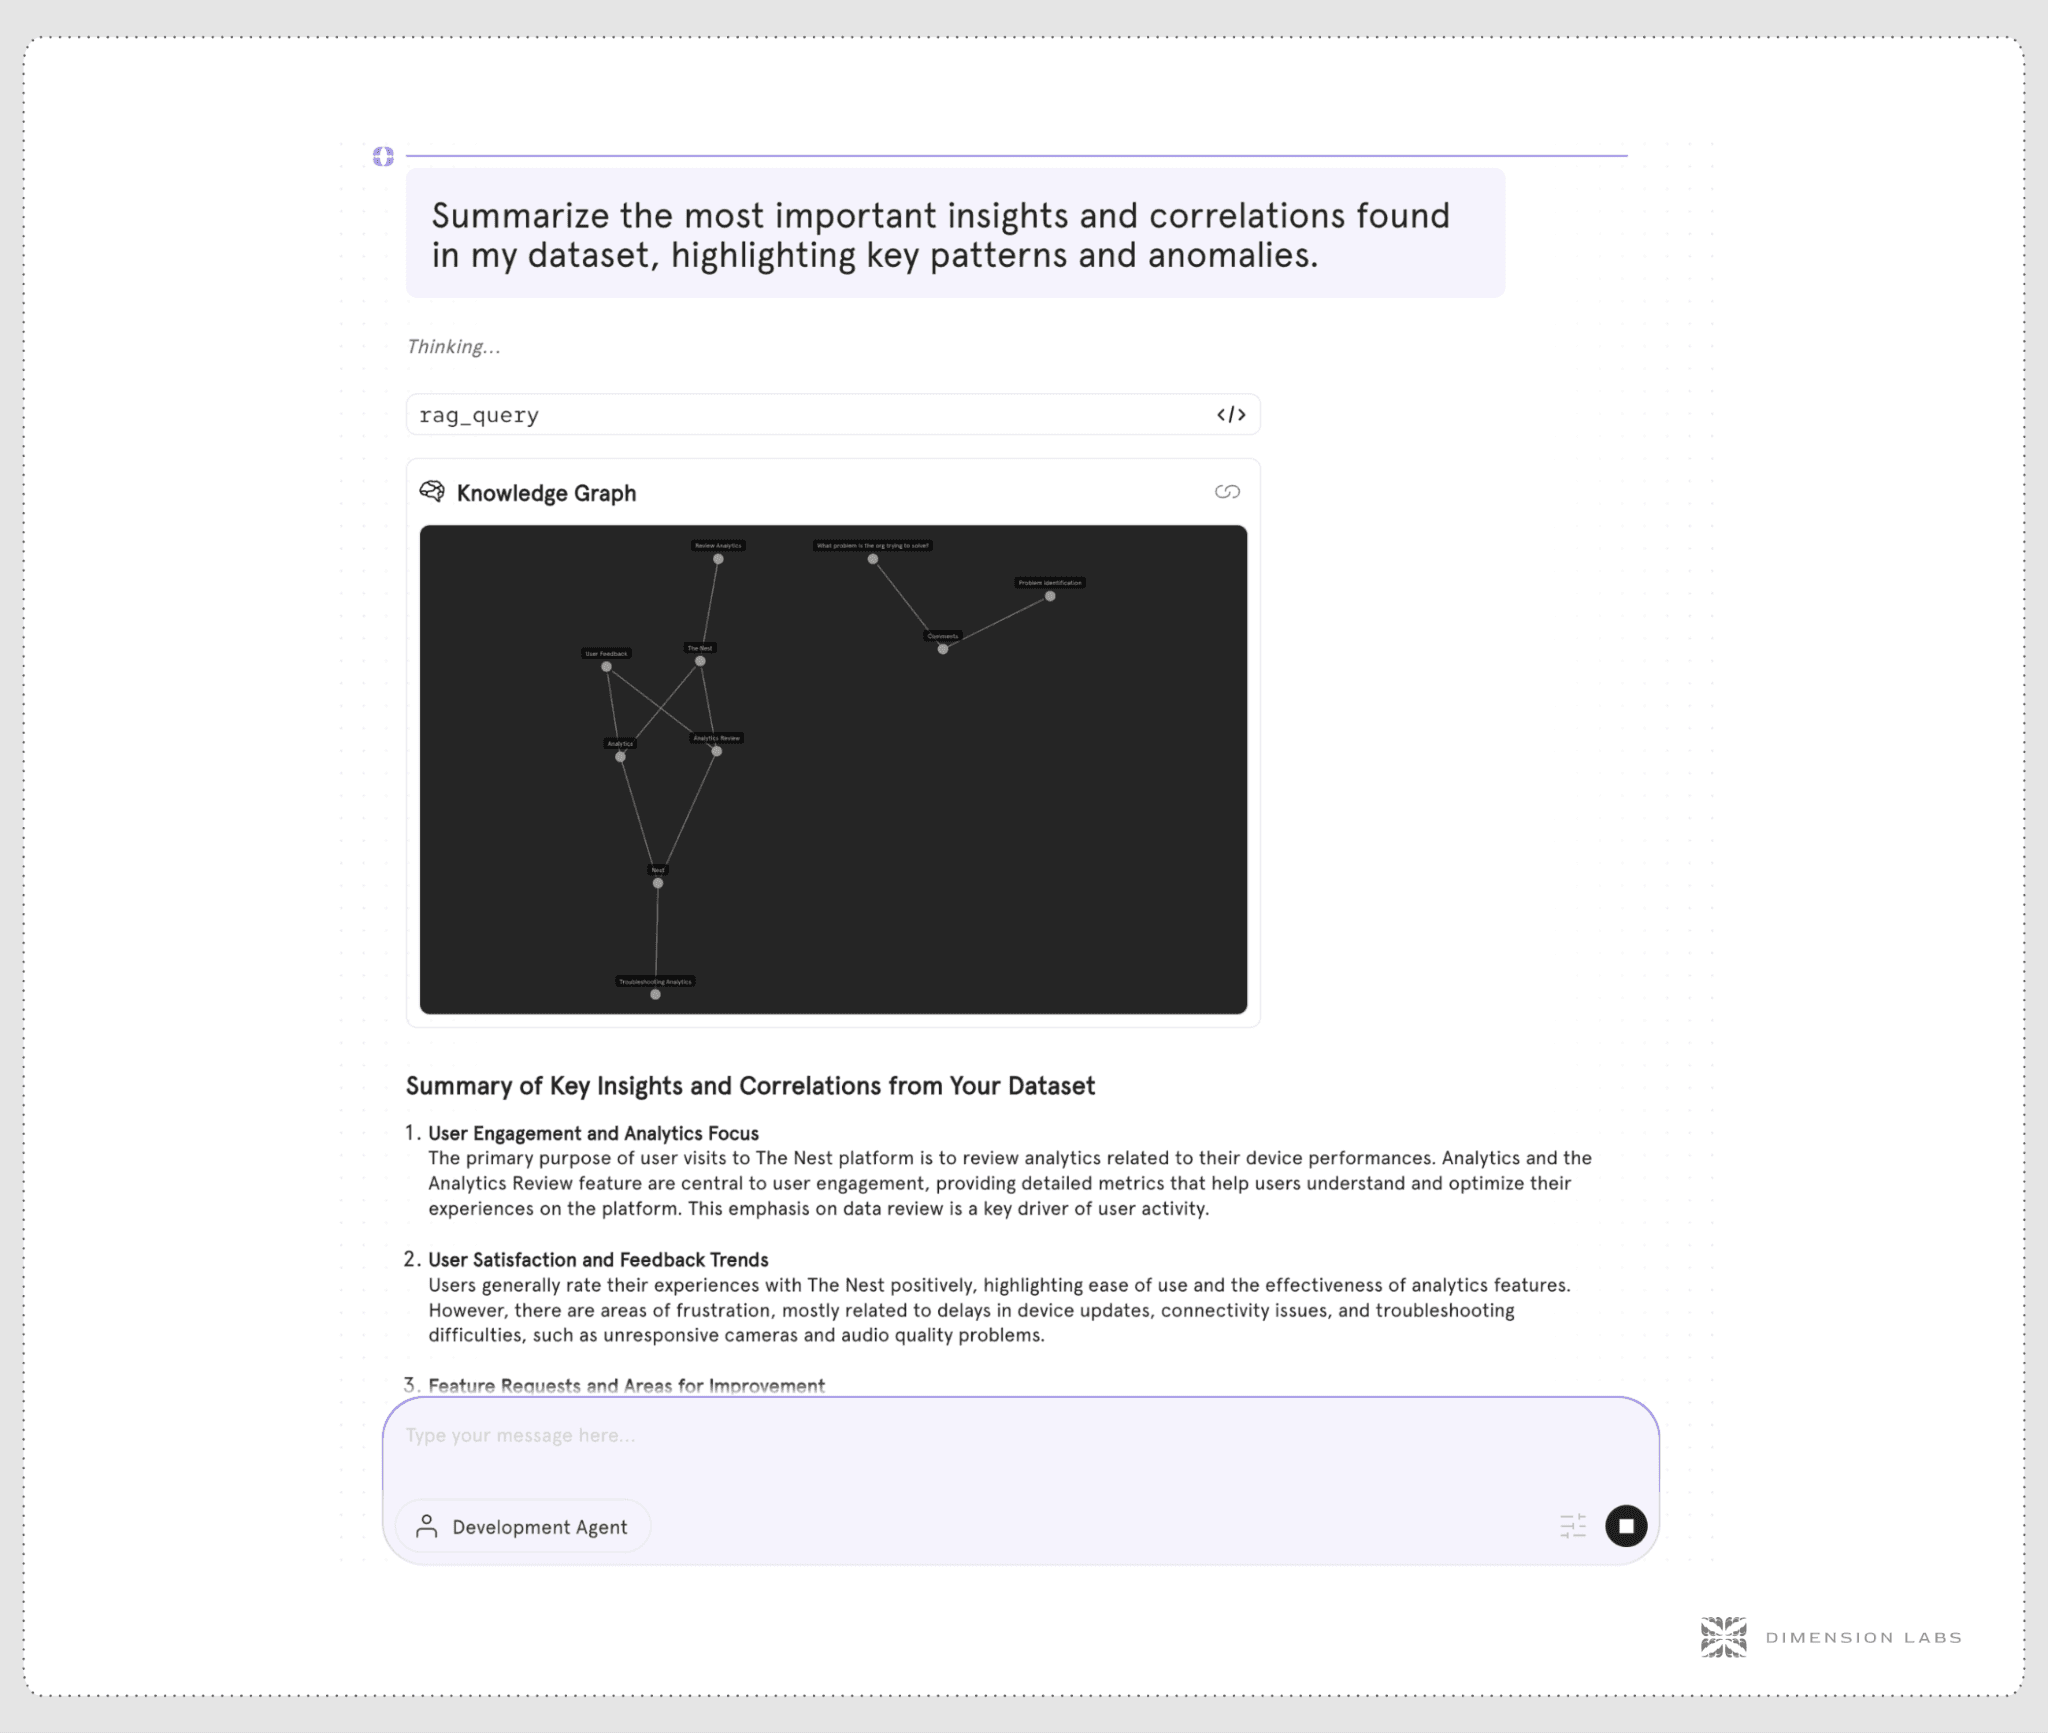
Behind the scenes, the system calls a Knowledge Graph Agent (rag_query) to retrieve the relevant subset of the graph. The graph serves as the reasoning substrate, grounding the model’s response in structured context rather than raw text.
The output isn’t just a summary — it’s an explanatory insight map, backed by relationships the system can show, trace, and quantify.
This is the future of querying: ask a question in natural language, and the system dynamically constructs the reasoning path across unstructured data.
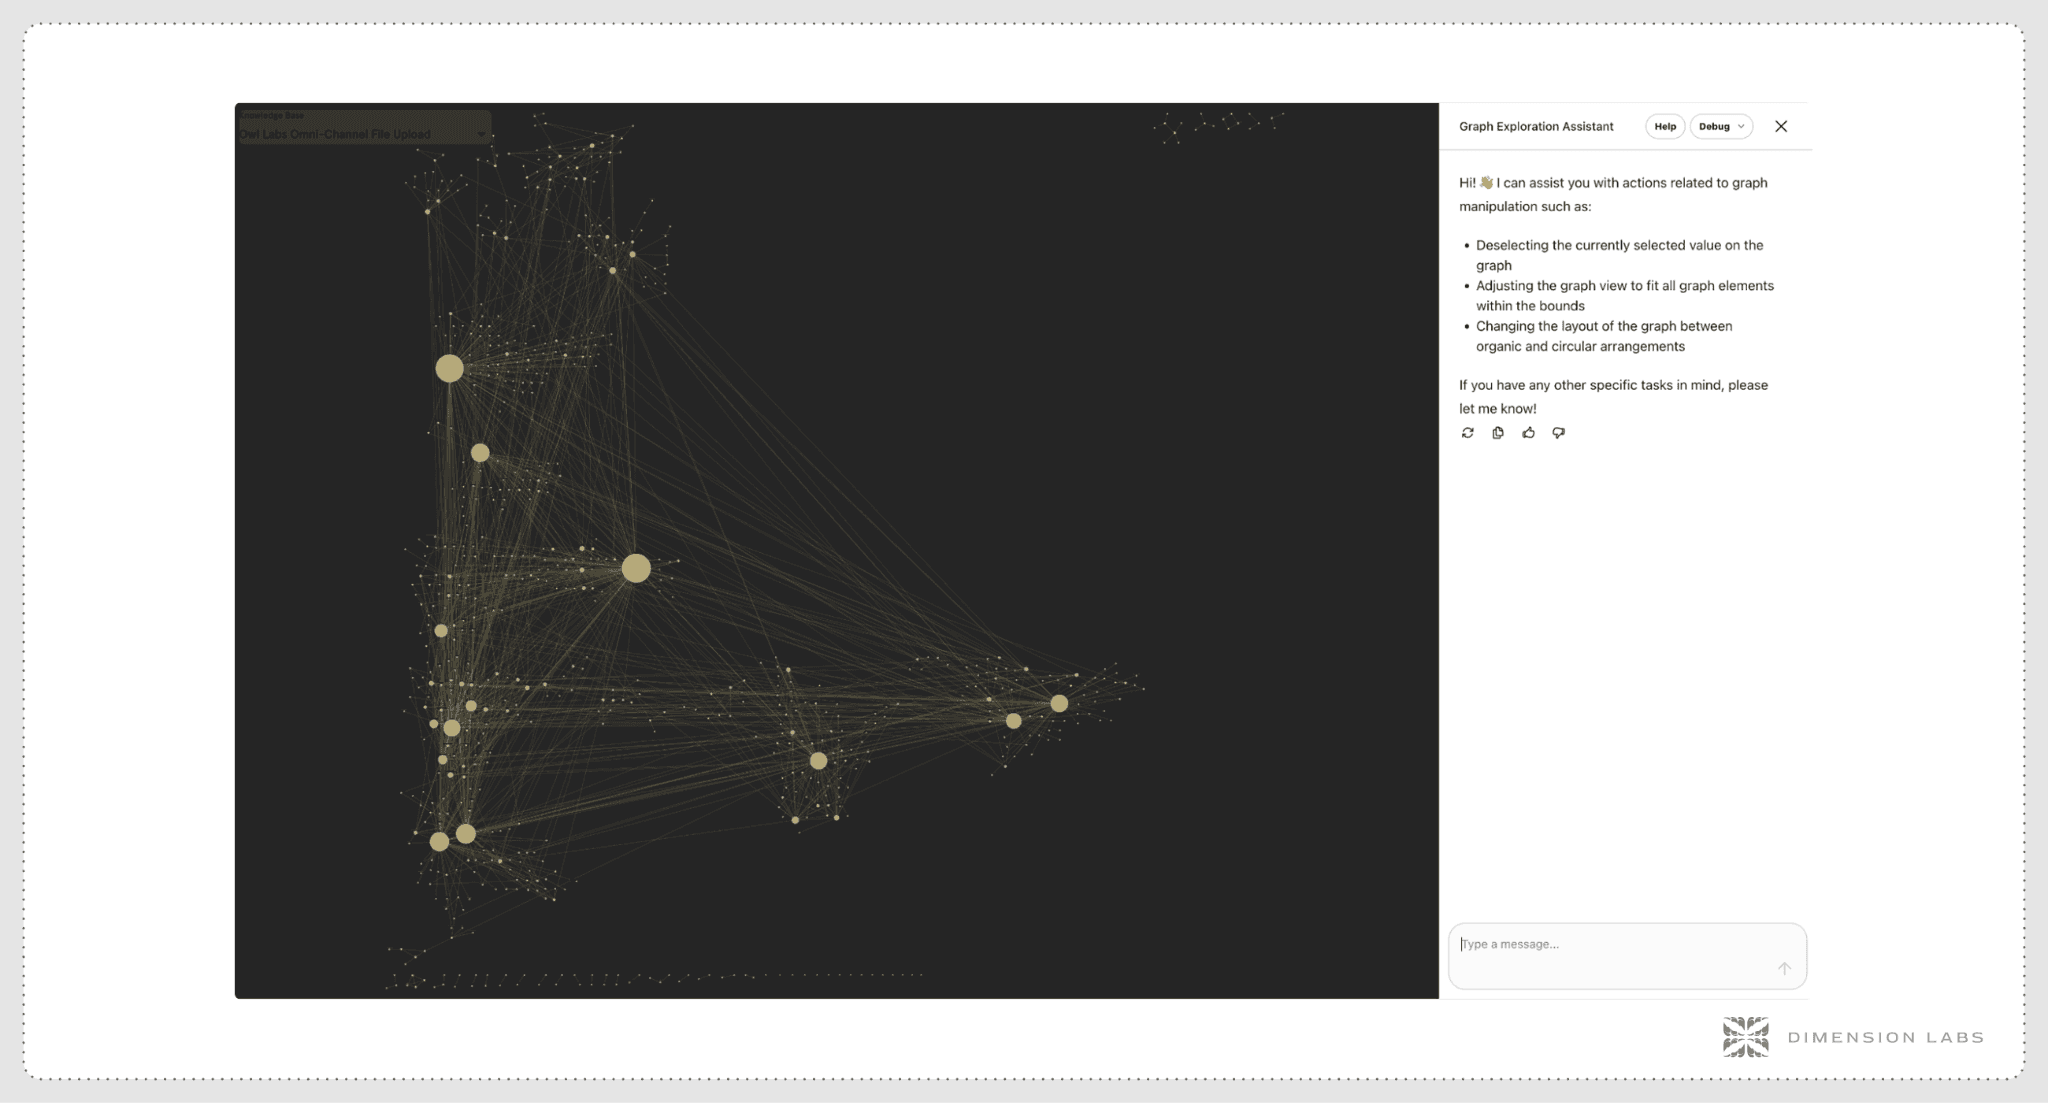
Charting Agents: From Query to Visualization
When users ask, “Give me a chart of all the major topics discussed,” the Charting Agent activates. It automatically gathers the structured results from the Knowledge Graph and generates a visualization — no manual SQL, no data prep.
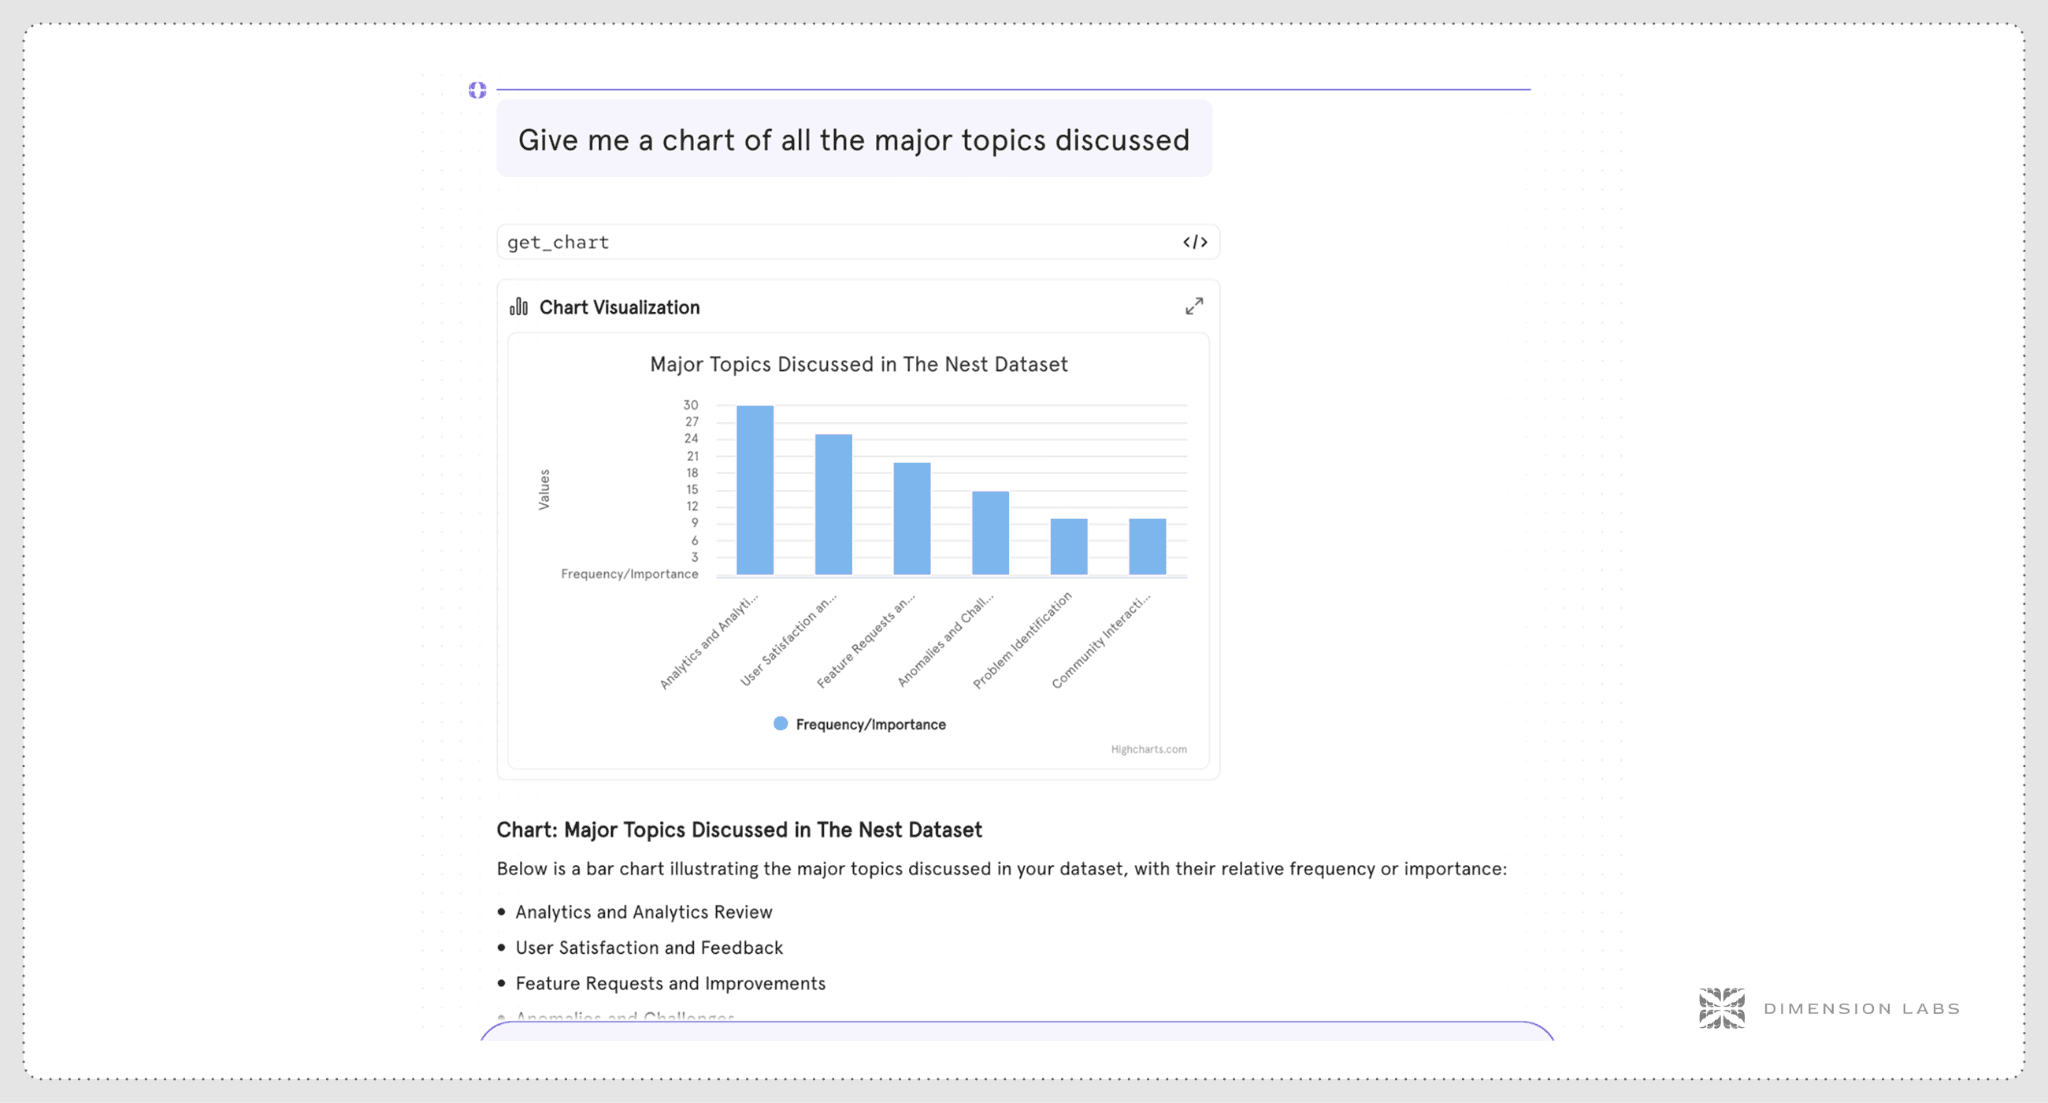
This turns data exploration into conversation. Instead of predefined dashboards, users engage in iterative discovery — each chart, insight, and query refining the next.
It’s analytics at the speed of thought.
Prompt Agents: Auto-Build Analytical Dimensions
Most of the world’s unstructured data analysis starts with schema design — defining “dimensions” like category, emotion, or churn risk. Historically, this has required data scientists or prompt engineers to manually encode logic.
Our Custom Prompt Agent changes that.
Users simply describe their business objective, and the agent auto-generates the necessary dimensions — complete with categories, definitions, and structured output fields.
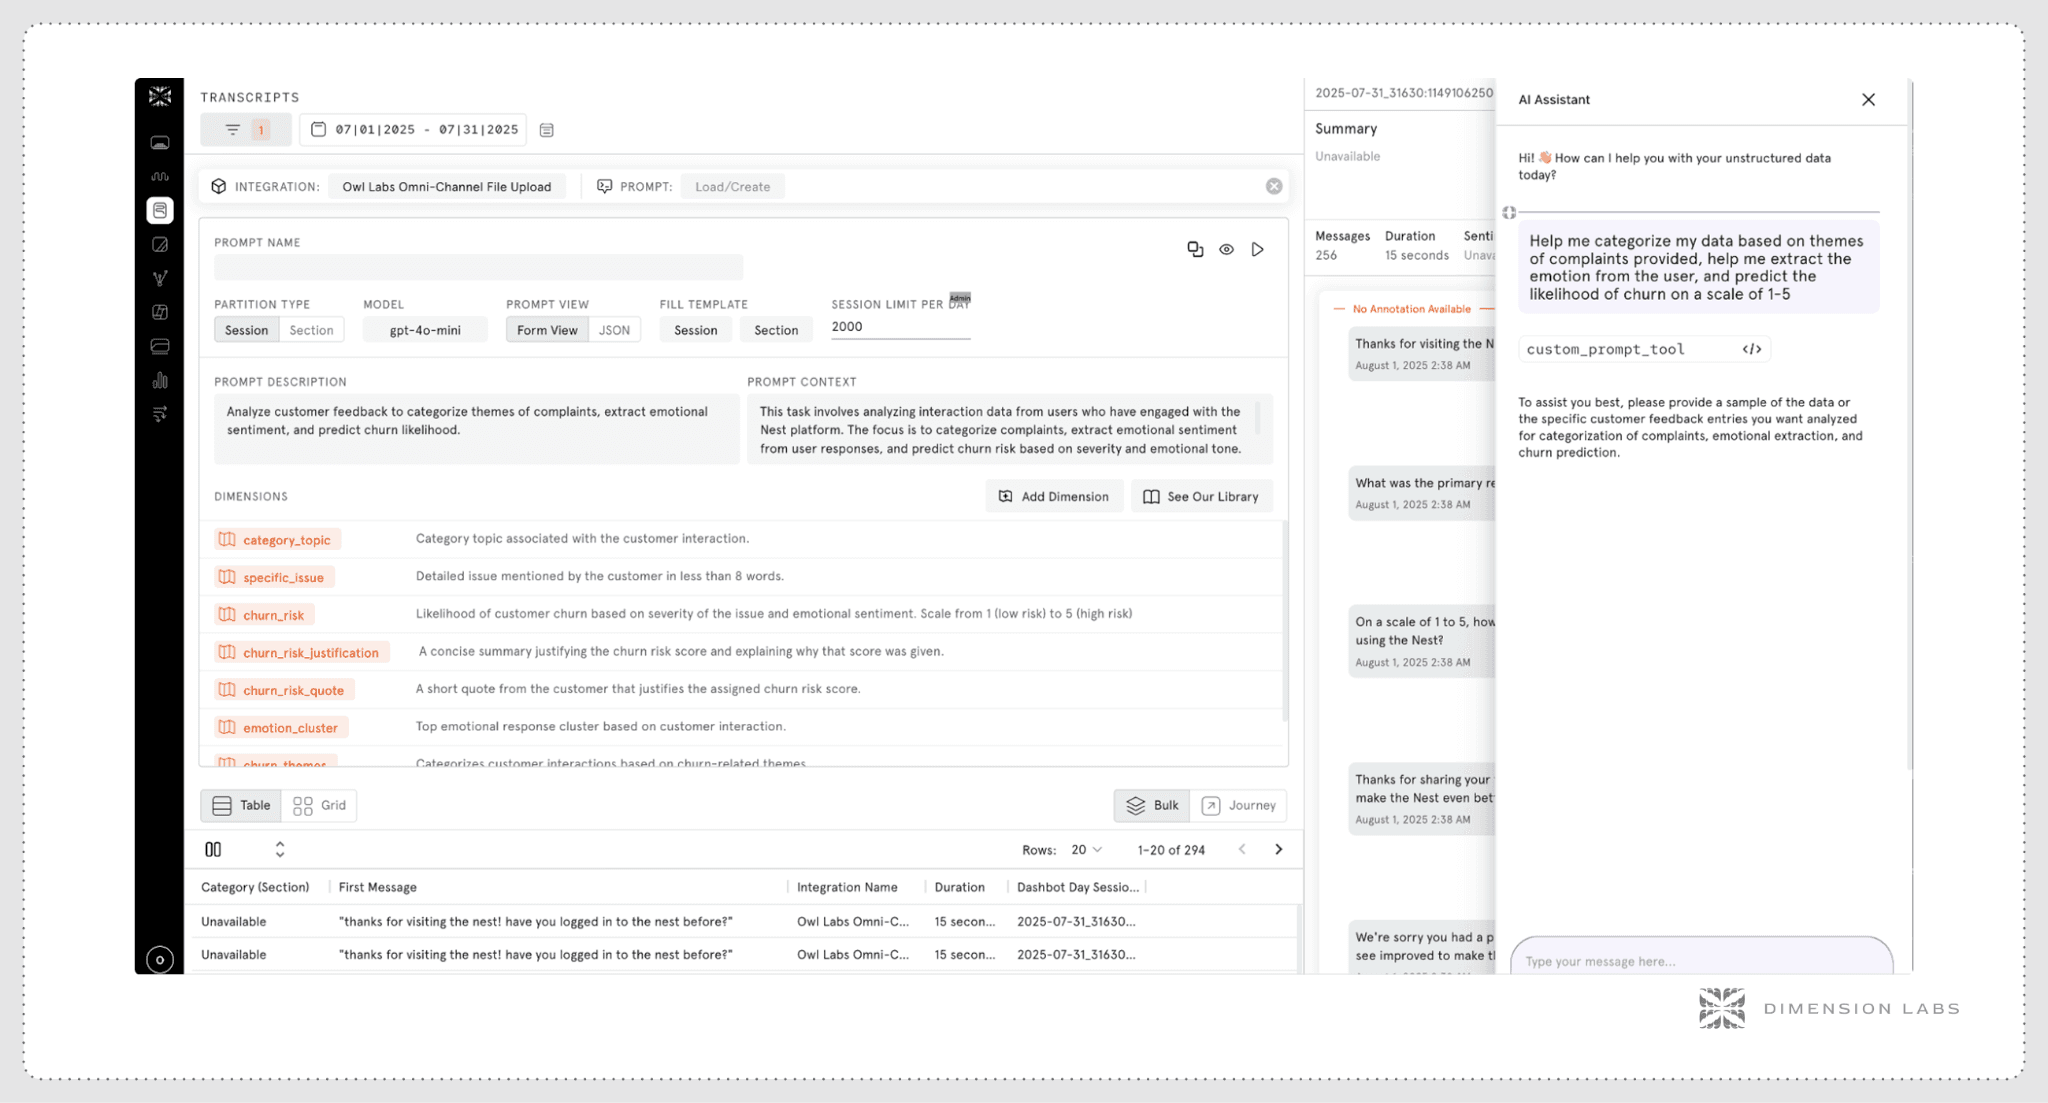
This transforms unstructured analytics into a no-code semantic modeling layer. What used to take hours of iteration now happens in seconds.
The Compound Effect: Agents + Graphs = Autonomous Insight
When combined, Knowledge Graphs and Agentic Workflows form a self-improving system:
The Knowledge Graph contextualizes new data automatically.
Agents retrieve, analyze, and act upon that context.
The results of those actions (charts, insights, enrichments) feed back into the graph.
Over time, the system learns not just what to analyze, but how to reason.
This is how the next generation of data teams will work — not by writing SQL queries, but by orchestrating intelligent systems that continuously extract signal from chaos.
What This Unlocks
The implications extend far beyond dashboards.
Autonomous Discovery of Emerging Themes
Agents can continuously scan live data for emerging correlations — surfacing “unknown unknowns” that traditional dashboards miss.Cross-Domain Reasoning
Knowledge Graphs unify disparate sources — call transcripts, chat logs, survey data — into a single reasoning network. This enables questions like:
“Which customer frustrations mentioned in chat correlate with support ticket escalations?”Predictive Action Loops
Agents can automatically flag churn risks or opportunities based on graph patterns, triggering alerts or suggested follow-up actions.Continuous Feedback Learning
As analysts interact with insights, their corrections and feedback become part of the system’s knowledge base, making it smarter over time.Enterprise Memory
Every discovery — every pattern, correlation, or anomaly — becomes a node in the organizational memory graph, ensuring knowledge compounds rather than resets.
The Future of Work in Data Intelligence
This new paradigm doesn’t replace analysts or engineers — it amplifies them.
In the near future, data teams will evolve from query writers to system orchestrators. They’ll define objectives and guardrails, while agentic systems autonomously explore, visualize, and validate hypotheses in real time.
We’re already seeing the rise of a new role — the Language Data Engineer — responsible for designing and maintaining the pipelines that turn raw conversation data into structured, actionable insights.
Their job isn’t to manage infrastructure — it’s to architect intelligence.
Dimension Labs and the Road Ahead
At Dimension Labs, we’re defining this next layer of the modern data stack — one purpose-built for language.
Our mission is to make the world’s unstructured data intelligible.
To give enterprises the tools not just to measure customer behavior, but to understand it.
To move from dashboards to dialogue — from queries to reasoning.
We believe the combination of Knowledge Graphs and Agentic Workflows will transform how businesses discover truth, make decisions, and act on intelligence.
In the same way data warehouses unlocked the quantitative revolution, this new Language Intelligence Layer will unlock the qualitative one.
It’s not about more data — it’s about deeper understanding.
And that’s the world we’re building.