American Dream Reviews: Parking Complaints Predict One-Star Visits, the Attractions Do Not
An analysis of 4,540 public Google reviews of the American Dream mall in New Jersey. Visitors love the attractions; the unhappy reviews are led by parking and the way out.
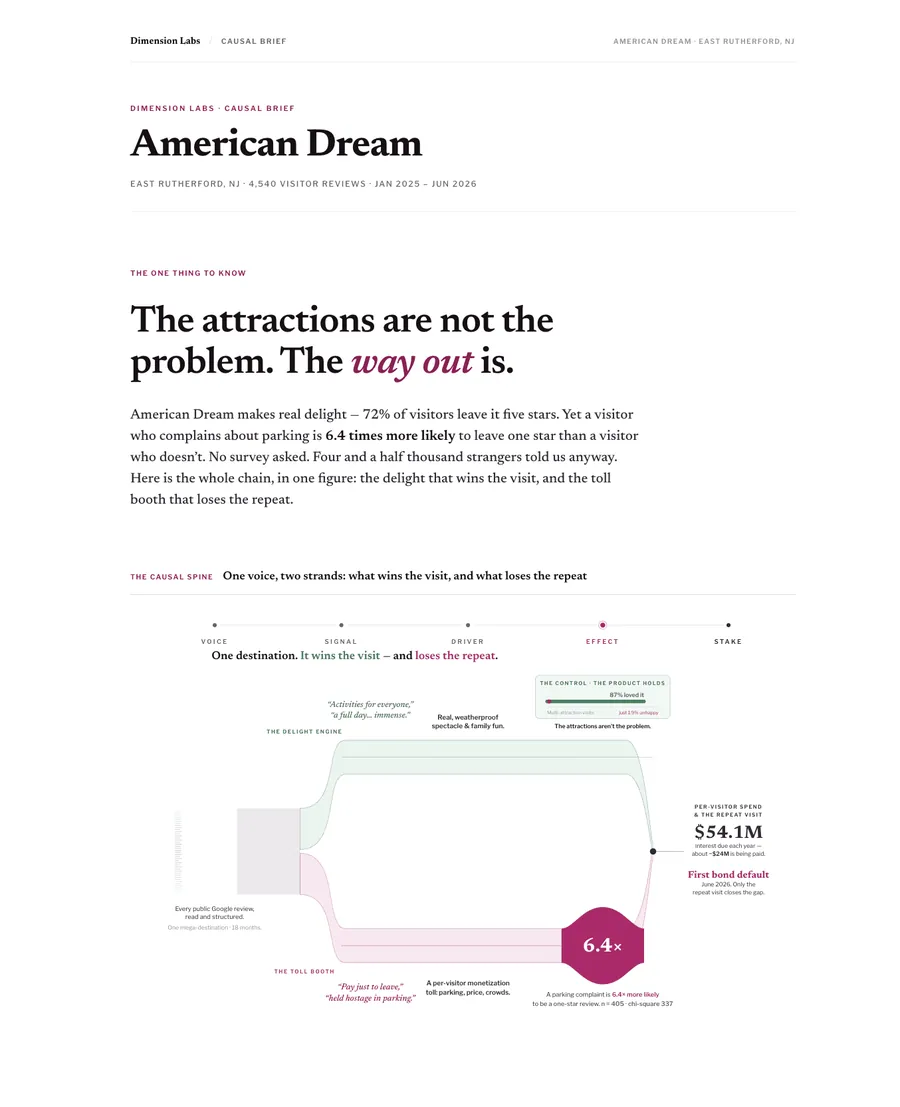
American Dream is a large destination mall with a water park, a theme park and an indoor ski slope. Its reviews are mostly glowing. This report asks whether the small unhappy share is scattered noise or points at one fixable thing.
What was analyzed
| Source | Public Google Maps reviews |
|---|---|
| Reviews | 4,540 distinct reviews, one row per review, no missing star ratings |
| Scope | American Dream, East Rutherford, New Jersey |
| Date range | January 1, 2025 to June 4, 2026 |
| Outcome | The review's own star rating, never a predicted label |
Key findings
- Most visitors are delighted. 72.1% of reviews are five-star and only 9.0% are one or two stars.
- Parking leads the unhappy reviews. Inside the one- and two-star reviews, parking and tolls is the largest theme at 35.4%, ahead of price, crowding, staff and every ride.
- A parking complaint goes with a one-star review. 28.2% of reviews that complain about parking are one star, against 4.4% of reviews without a parking complaint: 6.4 times as likely. Among reviews that already complain about something else, parking still raises one-star risk 2.2 times.
- The complaint is half price, half hassle. 53.1% of parking complaints are about cost, and 45.7% are about traffic, finding a space, the payment machine and the exit.
- The attractions hold up. Of the 1,111 reviews that mention more than one attraction, 87.0% are glowing and 1.9% are unhappy. The surface that tips negative is the food court, at 30.7% unhappy.
Exhibits from the report
From the report: American Dream: a causal brief

From the report: American Dream: a causal brief

From the report: American Dream: a causal brief

How the analysis was done
Every review was tagged with structured fields: sentiment, topic, the main friction or delight, parking, price, crowd, cleanliness and staff signals, the attraction mentioned, and whether the visitor recommends returning. Each lift compares the share of one-star reviews when the text carries a signal with the share when it does not. The parking result uses a two-by-two table with a Yates-corrected chi-square of 337 (p < 0.01), and a confound check that repeats the comparison only inside reviews that complained about something.
These are strong associations, not a controlled experiment. Thin attraction cuts are flagged as low confidence, and public financial figures in the report are cited as context only.
Related analysis
- What Goes With Bad Visits to American Dream? 4,540 Google Reviews
- Voice of the Customer Best Practices: A Quick Guide
- Every report in the Artifacts Gallery
To run the same analysis on your own reviews, tickets or surveys, start with your data.