














Skip to content
Product
PlatformPricingDimensionsIntegrationsSecurityCompare
Solutions · by use case
Customer, guest and fan experienceProduct feedback and prioritizationRevenue, churn and retentionAgenciesContact center performanceAI agent and chatbot analyticsMulti-location performanceReviews and competitive benchmarking
Solutions · by industry
Hotels and hospitalityRestaurants and food serviceFitness and leisureRetail and e-commerceSports and live entertainmentInsuranceBanking and financial servicesSoftware and SaaSAutomotiveConsumer products and CPGContact centers and BPOsPublic sector and nonprofitReal estateGaming and betting
Learn
Artifacts GalleryCustomer storiesResearchBlogThought leadershipLessons Log in Start now
Dimension Labs

Use case

Customer, guest and fan experience analysis

Upload your reviews, surveys, tickets and calls. Find which experience issue is really moving your score, and which is just loud.

Ask Which experience issue is actually costing us stars?

We work with enterprises such as NBA, Travelers, Mars and Concentrix.

NBATravelersMarsDisneyConcentrixIntuitSeattle MarinersDropboxAmerican Red CrossResideoNetflixThomson ReutersAsicsStakeEasygoFleishmanHillard
[01] The problem

They told you what's wrong. Your dashboard ranked it by volume.

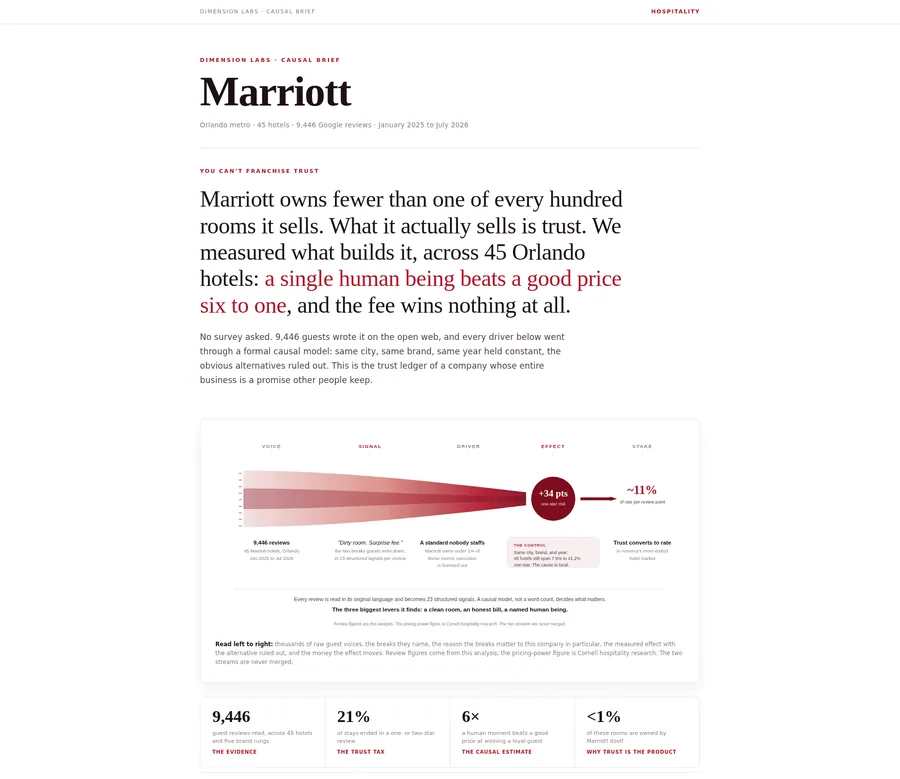
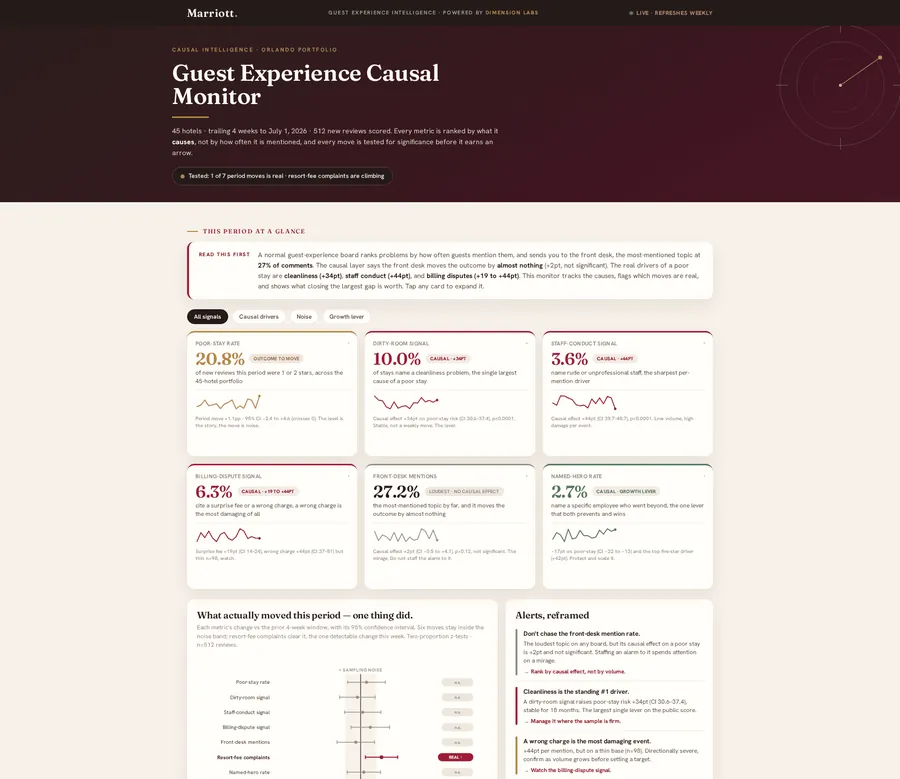
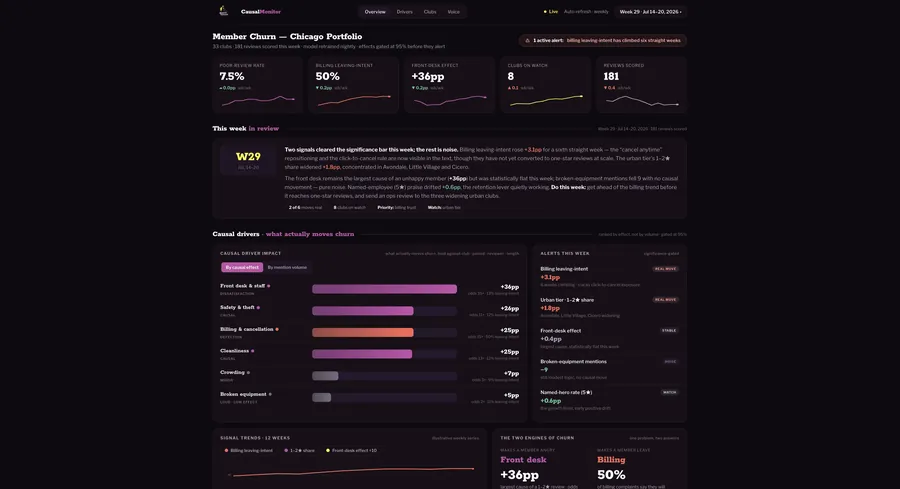
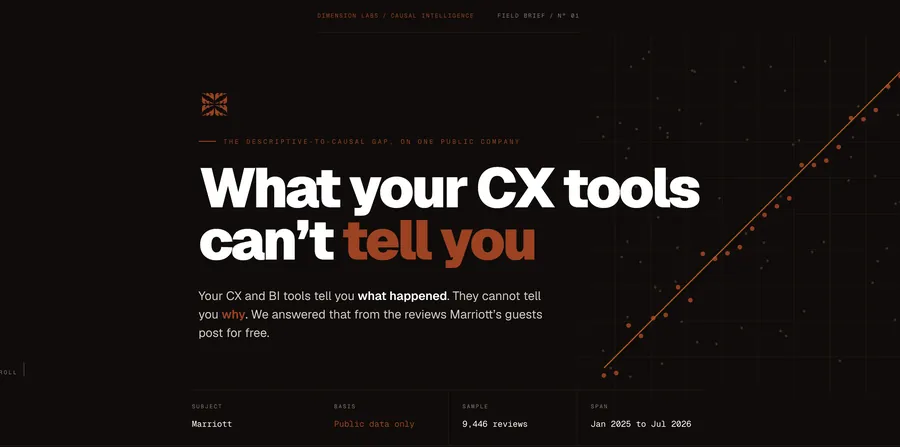
Every tool you own ranks by volume. Marriott's guests named front desk check-in constantly. It ranked #2 and moved star rating almost none.

Right now
  • 01The loudest complaint gets fixed first
  • 02Sentiment says people are unhappy, never what it costs you
  • 03Comparing locations stalls on inconsistent language
  • 04A score drops and the answer takes four weeks
  • 05Teams act on the average instead of the real driver

Knowing what they said is easy. Knowing which part actually moves your score is the job.

[02] EnrichOne record, structured

Language in. Structured data out.

Every record is read in full and written back with dozens of typed Dimensions, the same way every run. Here is what that looks like for this use case.

enrichment · one record
Raw text

We booked a suite for our anniversary and arrived to hair in the sink and a stained carpet. When I asked to move, the manager was dismissive and made us feel like the problem. Then a $39 resort fee we were never told about. We will not be back.

Google review · 1 star · property joined
Dimensions written to the record
  • Facility & Cleanlinessbroadly dirty
  • Primary Frictioncleanliness
  • Staff Interaction Qualitydismissive · named role
  • Service Recoveryrefused
  • Fee & Premium Changeundisclosed fee · $39
  • Price–Value Perceptionpoor
  • Loyalty Signalwill not return

Each colour links a phrase in the raw text to the Dimensions extracted from it. Hover either side.

[03] The product
3.1 · Read everything

Every record, enriched.

Start with one file. Reviews, surveys, tickets, calls, whatever your customers, guests or fans have already told you. Every record comes back enriched with structured Dimensions: root cause, effort, sentiment, escalation risk.

  • Start with one CSV or connect every channel you have
  • Join every conversation to account, agent and outcome data
  • Build custom Dimensions in plain English
  • Have the agent build context on your business
dimension labs · blend
3.2 · Prove the cause

Ask why. Get proof.

Ask in plain English. The agent writes the queries, runs the analysis, controls for the things that would confound it, and returns the finding with an effect size and confidence interval. It checks its own work.

  • Rank issues by causal impact, not complaint volume
  • Prove which fix would actually move your rating
  • Put a dollar figure on a specific experience failure
  • See what separates your best and worst locations
dimension labs · ask
Example finding

Which experience issue is actually costing us stars?

Cleanliness moved one-star risk by 34 points. Front desk, mentioned almost three times as often, moved it by about two.

8,504 public Google reviews · Marriott-family hotels in Orlando
3.3 · Deliver

Ask for the report. Get the report.

Say what you need and the agent builds it: executive summary, causal findings, charts, recommendations. Set it to rerun weekly or monthly on fresh data and it lands in your inbox. Export as HTML, PDF or slides.

  • Produce the monthly readout without building it
  • Send a link leadership can open and interrogate
  • Track whether the fix you shipped moved the metric
  • Export to PDF, slides or your BI tool
dimension labs · report
The priority list, rearranged by cause
The dashboard’s priority list by mention volume + correlation The causal ranking effect on a one-star stay Cleanliness 10.0% of comments 1 Front desk + check-in 27.2% of comments · flagged #2 2 Room maintenance 7.9% of comments 3 Staff attitude 3.6% of comments 4 Fees + billing 5.2% of comments 5 1 Staff attitude +44 pts 2 Cleanliness +34 pts 3 Room maintenance +21 pts 4 Fees + billing +19 pts 5 Front desk + check-in +2 pts · not significant The mirage
Exhibit from “What your CX tools can’t tell you”. Left: the standard CX-analytics ranking. Right: a DoWhy causal model on 8,504 rated public reviews, holding hotel, tier, language, review length and reviewer fixed. Every effect survives placebo, random-cause and subset tests.
[04] How the platform worksRuns daily

From raw conversations to a proven answer.

Language from every channel and your business data flow into one pipeline that enriches, governs and tests every record, then delivers wherever your team works.

Language · 37 sources
ZendeskIntercomSalesforceLiveChatDriftSlackQualtricsMedalliaSurveyMonkeyQuestionProGenesysAmazon ConnectAvaya Cloud8x8TwilioSMSAdaKore.aiYellow.aiCognigyRasaMicrosoft Bot FrameworkAmazon LexAmazon AlexaOracle Digital AssistantBotcopyCapacityFacebook MessengerKikX (Twitter)OpenAIEmailCall recordingsApp store reviewsGoogle reviewsOpen-ended surveysCommunity forums
Business + world data
SnowflakeDatabricksBigQueryAmazon S3Salesforce CRMCSV + ExcelREST APIRevenueOrdersRenewalsUsage eventsLoyaltyStore + location dataWeatherSeasonalityMarket events
Dimension Labs pipeline · Runs daily
01
Ingest + normalizeEvery channel and language into one schema
02
EnrichDozens of Dimensions written onto every record
03
Map + governValidated for drift, versioned, the same fields every run
04
Analyze + proveJoined to outcomes and tested for cause
Where it goes
Dimension Labs agentAsk, report, schedule
Your warehouseSnowflake, Databricks, BigQuery
BI toolsTableau, Power BI, Hex
Claude and ChatGPTvia MCP · coming soon
[05] ArtifactsBuilt by the agent

What you get. Reports, monitors and decks, built by the agent.

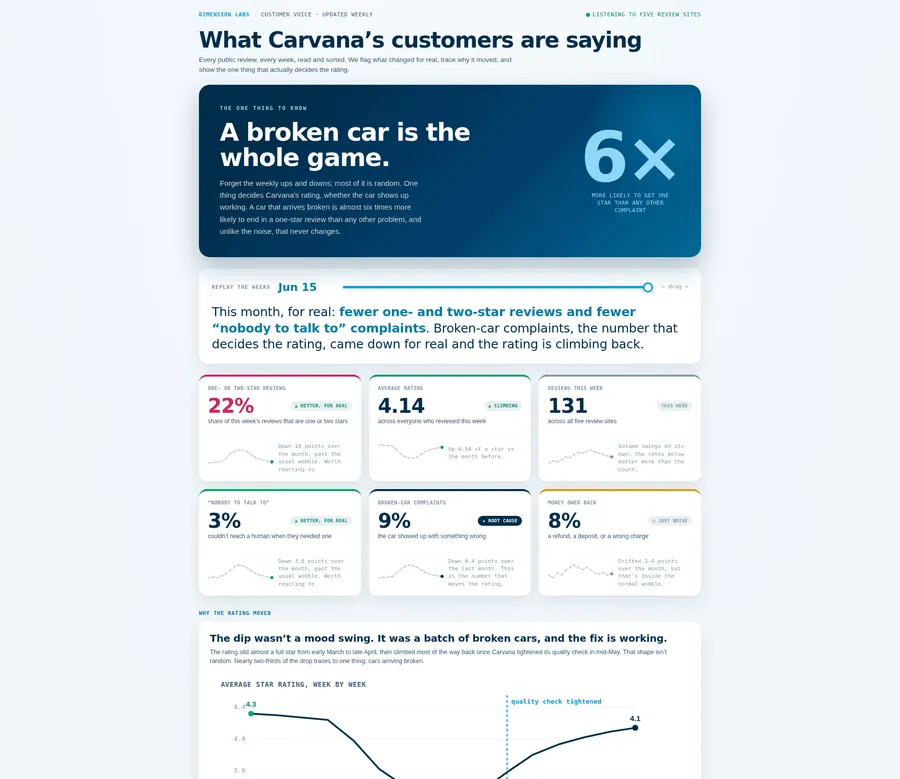
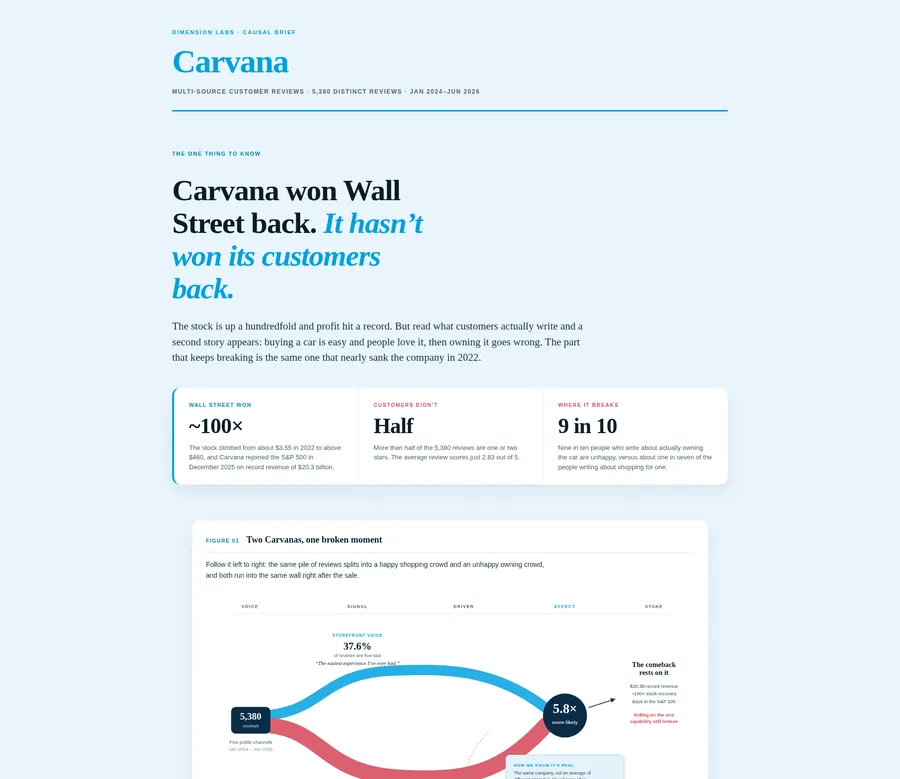
Reports · Live monitors · Apps · Decks · Charts See every artifact ›
[06] Proof
“Dimension Labs has become the default insight layer across the company.”

CX Manager, Stake.com

Read the Stake story ›
Dimension Labs/Start with one file From $299 a month

Find out what's really moving your number.

Start with one file. Ask why a number moved. Plans from $299 a month, no demo and no contract on monthly plans.