Carvana Reviews: Buying Is Easy, Owning Goes Wrong, and Unfixed Problems Cost the Most
A causal analysis of 5,380 public Carvana reviews from five sites. Shoppers and sellers are mostly happy; owners are not, and a problem left open does far more damage than the problem itself.
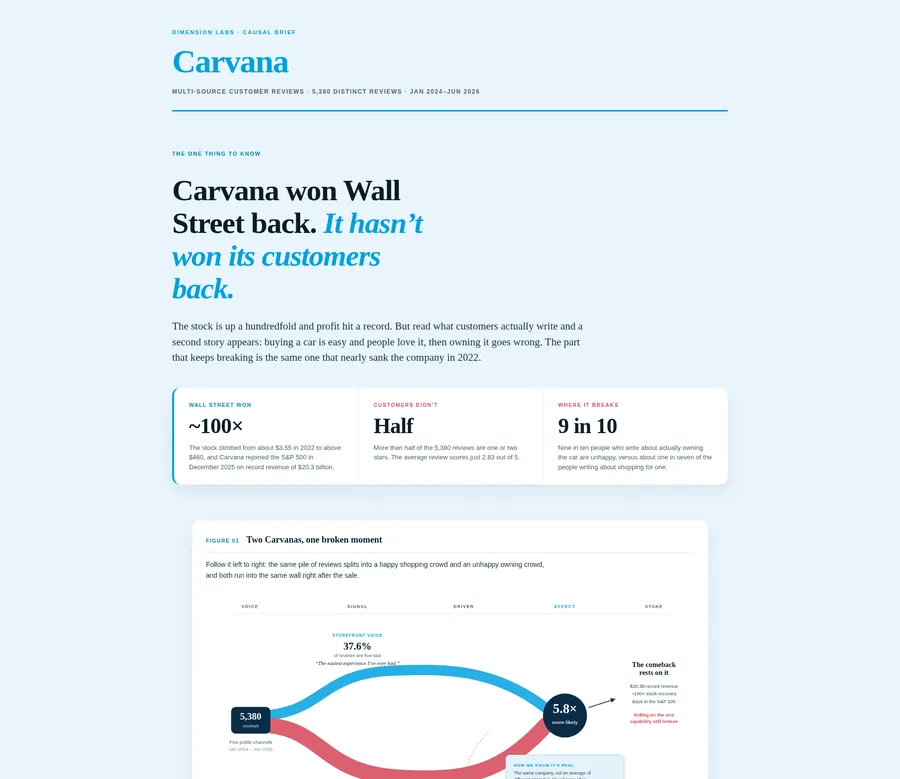
Carvana's average review score hides two very different groups of customers. This report splits the reviews by the moment they describe, before or after the sale, and then measures which after-sale problems actually push a review to one star.
What was analyzed
| Source | Trustpilot, BBB, Google Play, the App Store and Reddit |
|---|---|
| Reviews | 5,380 distinct reviews; 5,183 in the causal model |
| Date range | January 2024 to June 2026 |
| Structured fields | 25 dimensions per review |
| Outcome | A one- or two-star rating, or a BBB complaint |
Key findings
- The average hides two crowds. More than half of the 5,380 reviews are one or two stars and the average is 2.83 out of 5, yet only 9% land in the middle.
- The trouble starts after the sale. Reviews about browsing are unhappy 15.5% of the time; reviews about owning the car, 90.0%. On the BBB, 97.4% of 1,629 reviews are unhappy, against 23.2% of 1,194 on Google Play.
- Closing the loop is almost the whole effect. When a problem was resolved well, 5.1% of 311 reviews are unhappy; when it was never resolved, 98.1% of 1,395 are.
- A broken car and no one answering do the most damage. Holding channel, year, quarter and length constant, a mechanical defect raises the chance of a one-star review by 23.5 points, unreachable support by 17.2 and a delivery delay by 12.8; a refund or billing dispute adds 4.5.
- Title complaints are loud but do not move the rating. Once the channel is held constant, a title or registration mention has an effect of minus 4.4 points (95% range minus 8 to minus 1), because those complaints pile up on sites that are angry anyway.
Exhibits from the report
From the report: Carvana: a causal brief

From the report: Carvana: a causal brief

From the report: Carvana: a causal brief

How the analysis was done
25 structured fields were designed, validated against a stratified sample, and applied to every review: lifecycle stage, main friction, resolution, warranty, customer service, financial impact and more. The causal model uses 5,183 reviews (every rated review plus every BBB complaint). Each of five causes is estimated with logistic standardization (G-computation) holding channel, year, quarter and review length constant, with bootstrap confidence intervals and DoWhy propensity-score weighting as a cross-check. Every estimate goes through a placebo test, a random confounder and an 80% subsample.
This is observational review text, so the result is a refutation-checked ranking of causes, not a randomized experiment. Public company figures in the report are kept separate from the review numbers.
Related analysis
To run the same analysis on your own reviews, tickets or surveys, start with your data.