Home Depot Atlanta Reviews: Not Getting Help on the Floor Is the Biggest Problem
An analysis of 2,354 public Google reviews of 24 Home Depot stores in metro Atlanta. Stores in the same market differ widely, and the gap tracks whether shoppers could find help.
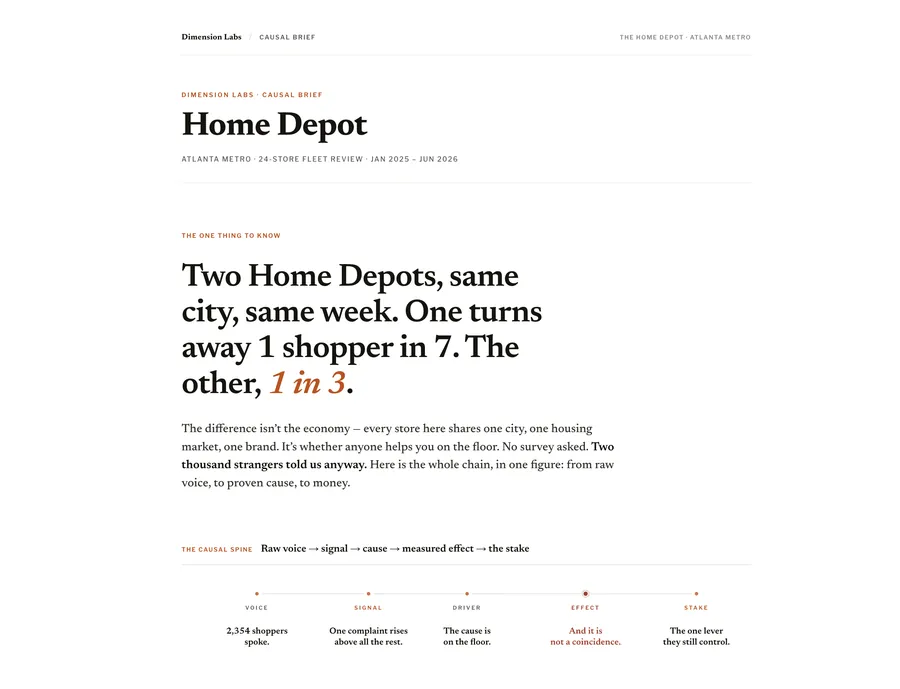
All 24 stores share one city, one housing market and one brand, so the economy cannot explain why one store gets far more unhappy reviews than another. This report reads every review to find what does.
What was analyzed
| Source | Public Google reviews, including 116 in Spanish |
|---|---|
| Reviews | 2,354 reviews |
| Scope | 24 Home Depot stores in the Atlanta metro |
| Date range | January 1, 2025 to June 12, 2026 |
| Outcome | A one- or two-star rating counts as an unhappy review |
Key findings
- "Couldn't get help" is the strongest signal. Reviews that mention not getting help are 16.5 times as likely to be one or two stars as reviews with no complaint (597 reviews, p < 0.001).
- It scores more than four times the next problem. Scored on how often it happens times how badly it hurts, "can't get help" reaches 9,849, against 2,278 for online orders and pickup, 1,097 for returns, 548 for installation and 359 for pricing.
- Stores in the same city are far apart. The share of unhappy reviews runs from 14.7% at 2525 Piedmont Rd NE to 32.8% at 1480 Satellite Blvd, a store with under 70 reviews. Among stores with enough reviews to trust, 4325 New Snapfinger Woods Dr is worst at 31.5% of 127 reviews.
- People are also why shoppers are happy. Shoppers praise a named employee 577 times, against 97 calling out a bad one, and 67.6% of the praise in happy reviews is for a helpful employee.
- Shoppers who leave cite service, not price. Lowe's is the most-named rival with 81 mentions, and 65 of those say they now prefer it; the most common reason is still not finding help.
Exhibits from the report
From the report: Home Depot: an Atlanta 24-store review analysis

From the report: Home Depot: an Atlanta 24-store review analysis

From the report: Home Depot: an Atlanta 24-store review analysis

How the analysis was done
Every review was tagged for its sentiment, store and department, the main friction or praise, whether a named employee was involved, and whether the shopper said they would come back. Each common problem was compared on how much it raises the chance of a one- or two-star review against reviews with none of these problems, then weighted by how often it happens. Lift figures carry two-proportion z-tests. Stores under about 70 reviews and shopper groups under about 25 are flagged to read with caution.
Reviews show the shopper's side of staffing, whether someone helped, not payroll or staffing ratios. Public financial figures in the report are cited as context only.
Related analysis
- Which Problems Go With Bad Reviews at Home Depot Stores?
- Conversation Analytics: What It Is and Why It Matters
- How to Build a Customer Experience Dashboard in 4 Steps
- Every report in the Artifacts Gallery
To run the same analysis on your own reviews, tickets or surveys, start with your data.