How to Compare Restaurant Locations Using Guest Reviews
Star ratings mix how a store is run with where it is. Using public reviews of 24 Atlanta restaurants, here is how to compare each location with stores like it.
A restaurant chain usually compares locations by star rating. But a store's rating mixes two things: how well the store is run, and where it sits. A downtown store with lunch rushes and a suburban one with a quiet dining room are not facing the same guests, and ranking them on one list rewards the easy addresses.
Public reviews can help separate the two if you group stores by the kind of location they are in and compare each store with its own group. Below, the method is applied to one chain.
The data: 24 Chick-fil-A restaurants in Atlanta
2,616 public Google Maps reviews of 24 Chick-fil-A restaurants in metro Atlanta, January 2025 to June 2026. The analysis counts 2,750 rows because about 134 reviews with line breaks were split on upload; the brief reports that this does not change the patterns, and the rates below are its figures. Every store sells the same menu from the same supply chain through the same app, and each is run by its own operator, so the brand is held roughly constant. The stores were picked across three rings: urban core (4 stores), inner suburban (11) and outer suburban (9).
Across all rows, 31.1% are one or two stars: 30.6% in the urban core, 36.1% inner suburban and 26.1% outer suburban.
From the brief
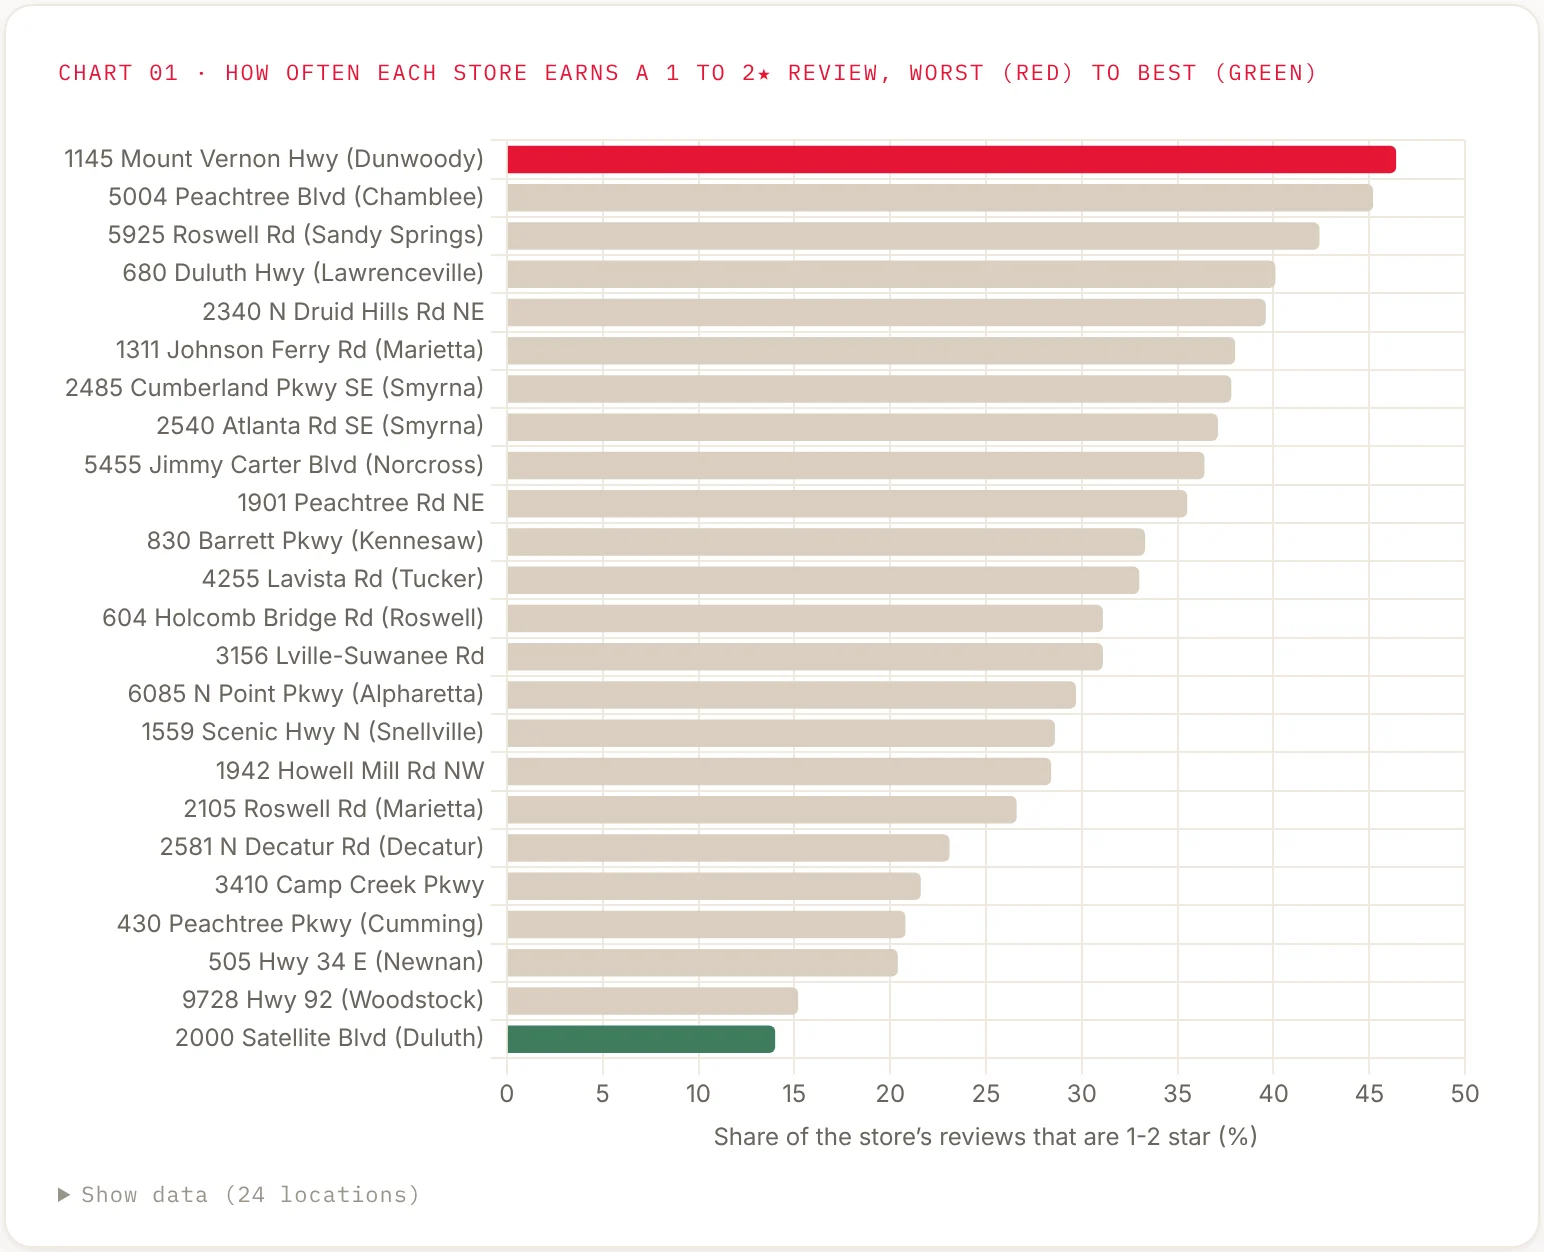
The raw ranking: Dunwoody worst at 46.4%, Duluth best at 14.0%
Share of each store's reviews that are one or two stars, worst to best.
Stores in the same ring are further apart than the rings are
The gap between ring averages is 10 points (26.1% to 36.1%). Inside the outer-suburban ring alone, the bad-review rate runs from 14.0% at Duluth to 40.1% at Lawrenceville, a 26-point spread inside one ring. The inner ring runs from 23.1% to 46.4%.
Dimension Labs analysis
Ranked against its own ring, Lawrenceville is the store furthest behind and Decatur the furthest ahead
Each store's share of one- and two-star reviews minus the average for its ring (urban core 30.6%, inner suburban 36.1%, outer suburban 26.1%), in percentage points.
In this set the spread between stores in the same ring is wider than the spread between rings. Ranking stores against their own ring also changes the list. Ranked on the raw bad-review rate, the five worst stores are Dunwoody, Chamblee, Sandy Springs, Lawrenceville and one on North Druid Hills Road. Ranked on the gap to their own ring's average, Lawrenceville moves to the top (14 points worse than its ring) and Kennesaw comes into the five, replacing Sandy Springs. At the other end, Decatur is sixth best on the raw ranking and best of all once its ring is taken into account, 13 points better than the inner-ring average.
Which problems go with bad reviews
Reading every review for the problem it names shows which failures go with a bad rating. When a guest describes rude or indifferent service, 84.2% of those reviews are one or two stars (406 reviews). Mobile and online order problems come next at 78.5% (107 reviews), then slow service at 77.0% (226), wrong or missing orders at 73.8% (328) and food quality at 69.1% (243).
From the brief
Rude or indifferent service ends in a one- or two-star review 84% of the time
When a review mentions each problem, the share that is one or two stars, against a 31% average.
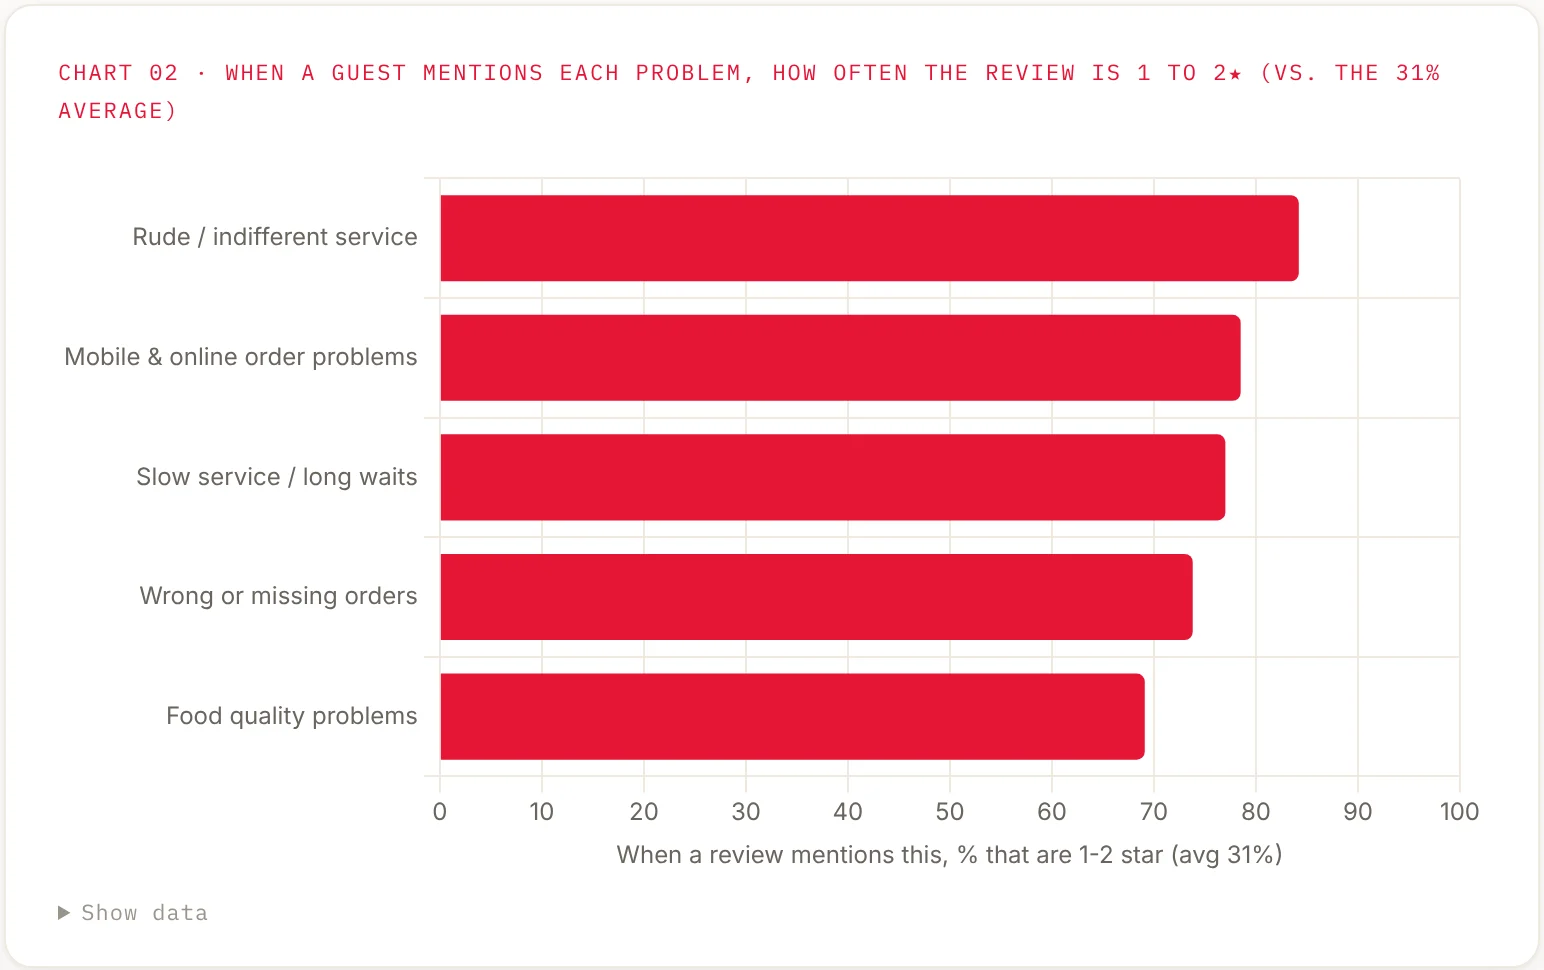
The link also holds inside each ring. A review that mentions a wrong or missing order is a one- or two-star review 78.7% of the time in the urban core, 75.5% inner suburban and 69.2% outer suburban, against 21% to 30% for reviews without one.
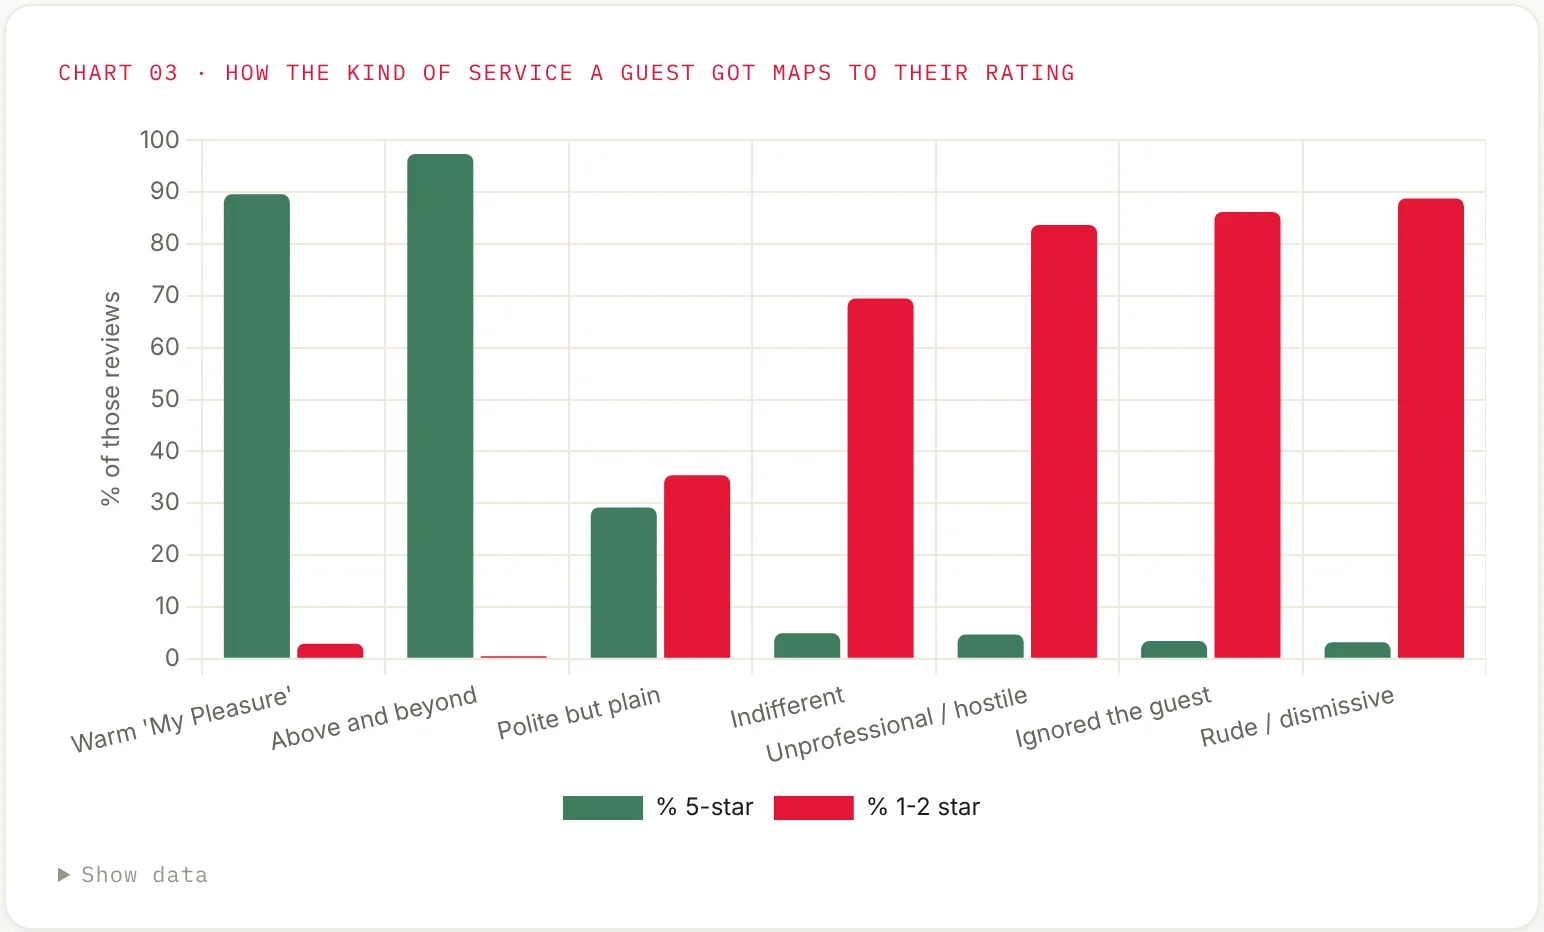
Stores also differ a lot on service. At Chamblee, 34.2% of reviews describe rude or indifferent service; at Duluth, 5.9%.
From the brief
The kind of service a guest describes tracks the rating closely
Share of five-star (green) and one- or two-star (red) reviews for each kind of service described.
How to do this for your own locations
Group stores by location type. Urban, suburban and highway, or mall and street, or whatever splits your locations by traffic and guest mix. Three or four groups is enough.
Use a rate, not the average star. The share of one- and two-star reviews is easier to compare and to explain than a 3.4 against a 3.6.
Rank each store against its own group. The gap to the group average is a fairer comparison than the raw rate, and a better list to start from.
Tag every review with every problem it names. Then check that each problem goes with bad ratings inside every group, not just across the chain.
Look at the problem mix for the stores at the top of the list. The problems a store's reviews name most often show where to look first.
Reviews come from guests who chose to post, often after a strong experience, so read the rates as a comparison between stores, not as the share of all visits that went badly. They also show association, not proof of cause; the brief calls its results strong associations and predictors. Stores with few reviews give noisy rates; this analysis only used stores with roughly 60 or more (the smallest had 64).
The full analysis, with the store table and the review dimensions behind each finding, is in the Atlanta restaurant brief. For why the most common complaint is not always the most damaging one, see which complaints cause bad reviews.
FAQ
Is the average star rating enough to compare restaurant locations?
Not on its own. It mixes how a store is run with where it is. Compare each store with stores in similar locations, and look at what its reviews say went wrong.
How many reviews does a location need?
There is no fixed rule, but very small counts make the rate unreliable. In this analysis every store had at least 64 reviews over 18 months.
Does this work for other kinds of multi-location businesses?
The method is the same for hotels, gyms, clinics or retail stores: hold the brand constant, group locations by type, and compare within the group. Our gym analysis compared clubs by club type in the same way.
Dimension Labs reads every review for every location, tags each one, and ranks stores against comparable stores. See multi-location intelligence and restaurants, or start with one file of reviews.